In the realm of operations management and systems analysis, transitioning from an As-Is state to a To-Be state is the critical bridge between identifying problems and solving them. This tutorial dissects the XYZ Manufacturing To-Be Business Process Diagram, a sophisticated visual representation of an optimized manufacturing environment.
This architecture leverages Proactive Scheduling, Just-in-Time (JIT) inventory principles, and Real-Time Quality Management Systems (QMS) to drive efficiency. By breaking down this complex system architecture, we will explore how modern manufacturing integrates data flow with physical execution.
1. The Foundation: Understanding the Swimlane Architecture
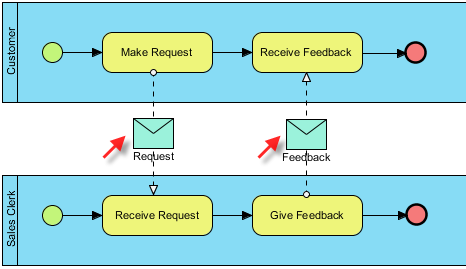
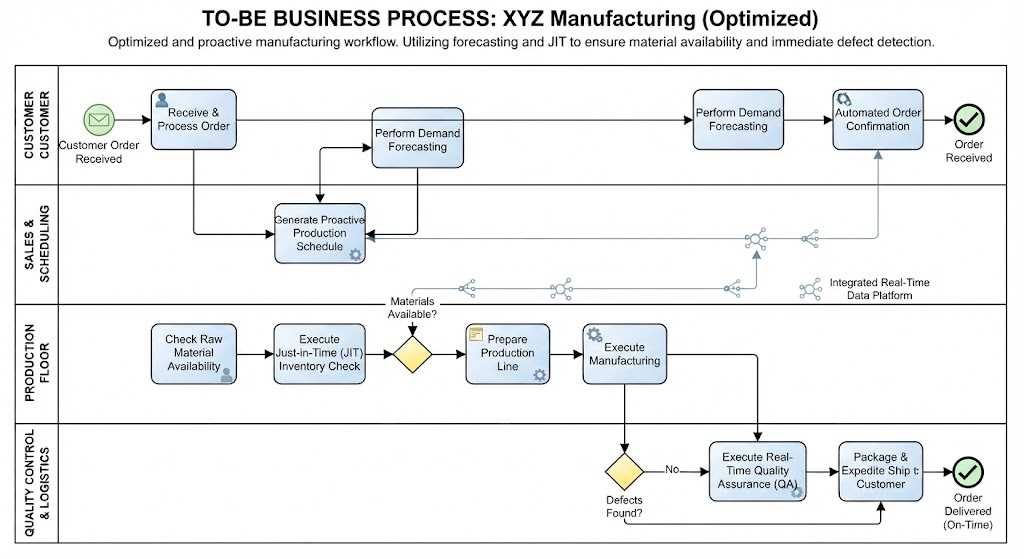
The diagram is structured using Swimlanes, a standard modeling convention in BPMN (Business Process Model and Notation). Swimlanes categorize tasks by the functional role or department responsible for them. In the XYZ Manufacturing model, we see four distinct layers:
- Customer: The trigger for the entire process. This lane represents the external input and the final satisfaction metric.
- Sales & Scheduling: The “Brain” of the operation. This layer handles data processing, demand forecasting, and the generation of production schedules.
- Production Floor: The “Hands” of the operation. This is where physical work occurs, including material checks and the actual manufacturing execution.
- Quality Control & Logistics: The “Guardians” of the process. This layer ensures the output meets standards before the final handover to the customer.
2. The Trigger: Demand Forecasting and Order Processing
The process begins in the Customer and Sales & Scheduling lanes. Unlike traditional reactive manufacturing, where production starts only after a specific order is placed, the To-Be design introduces a proactive element.
The Data Flow Logic
- Receive & Process Order: The process initiates with the receipt of a Customer Order. This is the primary input event.
- Perform Demand Forecasting: This is a critical step for the “To-Be” state. The system does not just accept the order; it analyzes it alongside historical data to predict future demand.
- Generate Proactive Production Schedule: Based on the forecasting, the system automatically generates a schedule. This is depicted by the bidirectional flow between forecasting and scheduling, indicating an iterative refinement process.
- Automated Order Confirmation: Once the schedule is viable, the system confirms the order. This loop closes the customer interaction, providing immediate feedback.
Key Takeaway: The integration of Demand Forecasting transforms the workflow from reactive to proactive, allowing the manufacturing floor to prepare before the final order is even confirmed.
3. The Execution: Just-in-Time (JIT) and Material Availability
As the process moves to the Production Floor, the architecture focuses on efficiency and waste reduction, hallmarks of Lean Manufacturing.
The “Materials Available?” Decision Node
The diagram features a crucial Decision Diamond labeled “Materials Available?”. This node represents the logic gate for the Just-in-Time Inventory strategy.
- Check Raw Material Availability: The system queries the inventory database.
- Execute Just-in-Time (JIT) Inventory Check: This step ensures that materials are neither overstocked (which ties up capital) nor understocked (which halts production).
- The Branching Logic:
- If Yes: The process flows seamlessly to Prepare Production Line.
- If No: The system triggers an alert (indicated by the branching path towards the Integrated Real-Time Data Platform) to procure materials immediately.
This synchronization with the Integrated Real-Time Data Platform ensures that the “Brain” (Sales) and the “Hands” (Production) are operating on the same data set, preventing bottlenecks caused by missing parts.
4. Quality Assurance: The Feedback Loop
The final stage of the workflow, managed by Quality Control & Logistics, demonstrates the power of the Real-Time QMS mentioned in the context.
The QA Decision Gate
Before an order is shipped, it encounters a final Decision Diamond labeled “Defects Found?”. This is not a post-production audit but an in-line quality check.
- Execute Manufacturing: The product is built.
- Execute Real-Time Quality Assurance (QA): Data from sensors or inspection tools is analyzed immediately.
- The “No” Path: If defects are found, the diagram shows a feedback loop. This is vital for a To-Be design; it allows the system to trigger a corrective action (rework) immediately rather than passing a defective product to the next stage.
- Package & Expedite Ship to Customer: Only upon passing the QA check does the order move to logistics.
5. Conclusion: From Analysis to Value
This To-Be Business Process diagram is more than just a chart; it is a blueprint for operational excellence. By implementing this architecture, XYZ Manufacturing achieved significant improvements as noted in the case study:
- Lead Time Reduction (30%): Achieved through proactive scheduling and JIT inventory checks.
- Defect Rate Reduction (40%): Driven by the immediate detection and feedback loop in the QA lane.
- Customer Satisfaction (90%): The result of on-time delivery and high-quality output.
Understanding the flow of data—from the customer order, through the forecasting engine, to the physical production floor and quality gates—is essential for any technical analyst looking to optimize complex business systems.