


Setting the Stage: The Big Picture
Welcome back, designers! Today, we are going to zoom out and look at the “big picture” of software architecture. When you start building a complex application, it’s easy to get lost in the weeds of internal logic and database schemas. But before you write a single line of code or draw a detailed flowchart, you need to understand where your system fits in the wider world.
This is exactly what a System Context Diagram does. It acts as a high-level map, showing your central system (the “system under design”) and how it interacts with the outside world. In this tutorial, we will walk through a practical example of an E-Commerce Platform, visualizing how different actors and systems connect.
The Central Hub: Your System Under Design
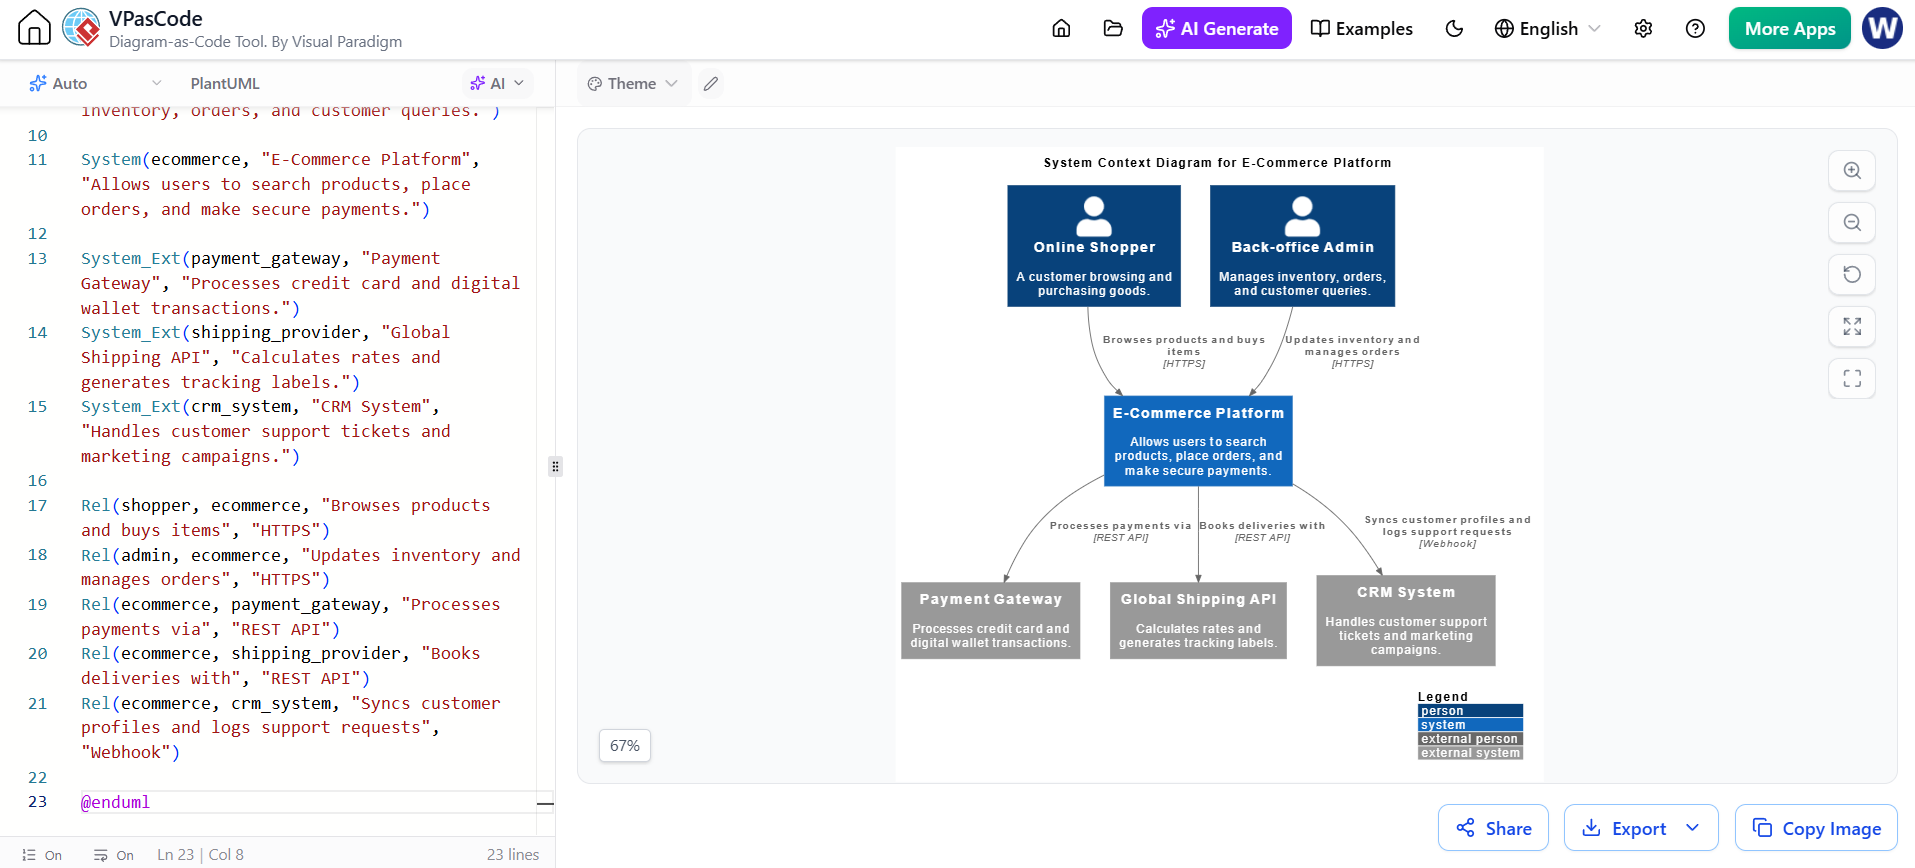
In any context diagram, there is one star of the show: the central system itself. In our scenario, this is the E-Commerce Platform. You can see it represented as the blue box right in the middle of the diagram.
This isn’t just a random box; it represents the entire ecosystem you are building. Its description—”Allows users to search products, place orders, and make secure payments”—summarizes its core value proposition. Everything else on this page exists only because they interact with this central hub.
Identifying External Entities
A system never operates in a vacuum. To function, it needs inputs from people and other systems. These are called External Entities. Let’s break down the four distinct types of entities interacting with our E-Commerce Platform:
1. The Online Shopper
At the top left, we have the Online Shopper. This represents the end-user. In architectural terms, this is a Person entity. They are the ones initiating the most critical action: browsing and buying. Notice the arrow flowing from them to the platform labeled “Browses products and buys items.” This tells us that the user provides data (search queries) and receives data (product listings) via the HTTPS protocol.
2. The Back-office Admin
Next to the shopper is the Back-office Admin. While the shopper drives sales, the admin ensures the engine keeps running. This entity handles inventory updates and order management. Interestingly, notice the bidirectional nature of their relationship? They update the system, but the system also reports back on order statuses. This interaction is crucial for maintaining business continuity.
3. The Payment Gateway
Now, let’s move to the technical integrations. No modern store accepts money without a specialized partner. Here, we see the Payment Gateway. This is an external system responsible for the heavy lifting of financial security. The diagram shows the E-Commerce Platform sending payment details to the gateway via a REST API. This separation of concerns is vital—you don’t want your main app handling raw credit card numbers directly!
4. Global Shipping API & CRM System
Finally, we have two more critical partners at the bottom. The Global Shipping API calculates rates and generates tracking labels, ensuring the physical goods actually reach the customer. Meanwhile, the CRM System sits on the far right, syncing customer profiles and logging support requests. This allows your marketing team to track who bought what without cluttering the primary transactional database.
Understanding the Data Flows
What makes this diagram truly powerful is not just the boxes, but the lines connecting them. These arrows represent Data Flows. They tell the story of how information moves.
- HTTPS: Used for human-to-system interactions (like the Admin or Shopper), ensuring secure web traffic.
- REST API: The standard language for machine-to-machine communication, used here between the Platform, Payment Gateway, and Shipping API.
- Webhook: A specific type of callback mechanism used here for the CRM System, allowing real-time updates when events occur.
By defining these protocols explicitly, you prevent ambiguity during development. The developers know exactly how the systems should talk to each other.
Why Use Visual Paradigm for This?
Creating these diagrams manually in tools like PowerPoint or Visio can be tedious, especially when you need to update connections frequently. That’s where the power of diagramming tools comes in.
Using a tool like Visual Paradigm allows you to leverage “Diagram-as-Code” approaches (like PlantUML). Instead of dragging and dropping boxes, you can define your system structure in text, which automatically renders into the professional layout you see here. This approach is perfect for teams who prefer working in code editors or want version control over their diagrams. It ensures that your documentation stays synchronized with your actual system architecture.
Key Takeaways
To wrap up, remember that a System Context Diagram is your first step toward architectural clarity. By defining the central system and mapping out its relationships with external entities—whether they are humans like Shoppers and Admins, or automated systems like Payment Gateways and CRMs—you create a blueprint for success.
Always ask yourself: Who touches my system? What do they send me? And how do I respond? Once you answer those questions clearly, you are ready to dive deeper into the internals.
Related posts:
 Refining Use Case Diagrams: From Basic to Advanced E-commerce Models
 Mastering System Context Diagrams with PlantUML
 Mastering the C4 Model: A Step-by-Step Guide to the Container Diagram for an Internet Banking System
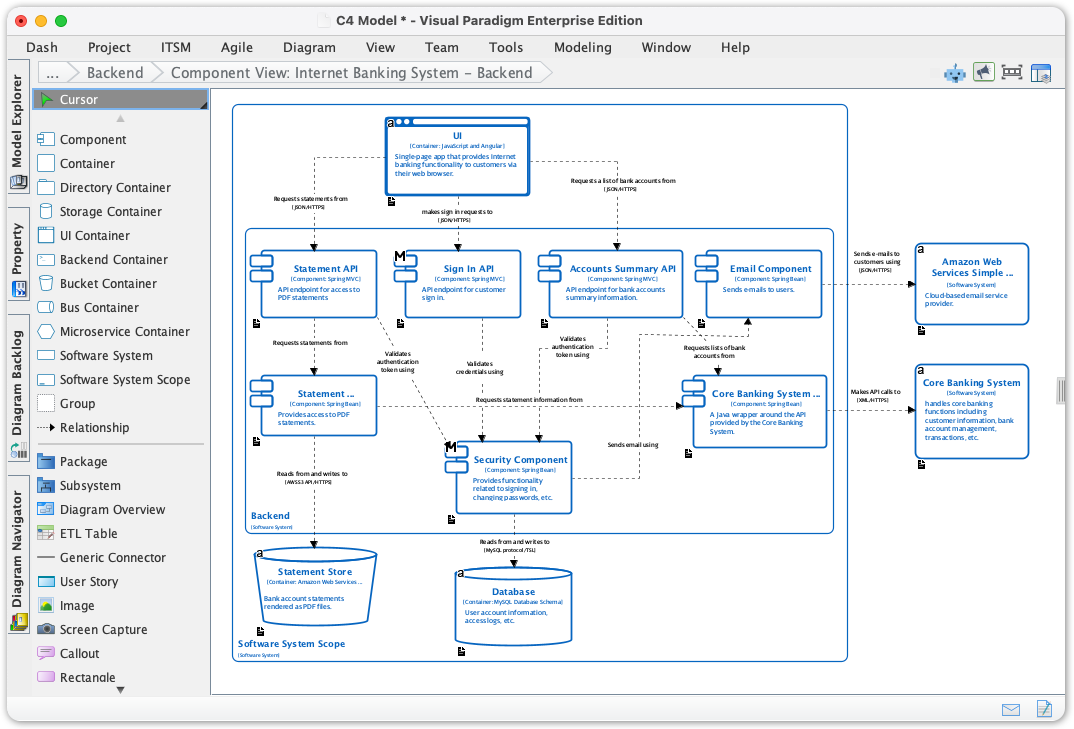 Mastering Software Architecture: A Deep Dive into C4 Component Diagrams with Visual Paradigm