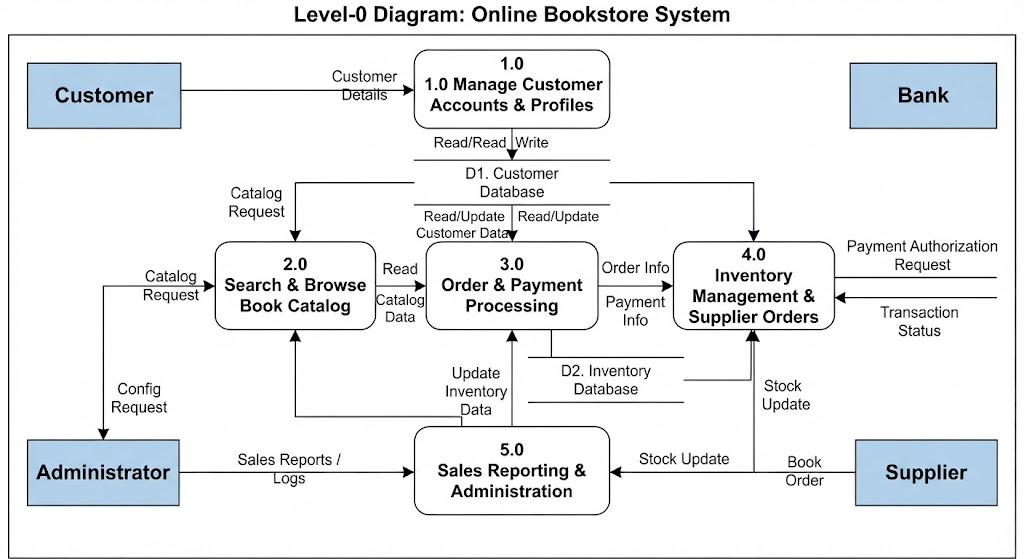
When we dive into systems analysis and design, one of the most effective ways to visualize how a software application functions is through a Level-0 Data Flow Diagram (DFD). This diagram serves as a high-level map, showing us the “big picture” without getting bogged down in the nitty-gritty details. Today, let’s walk through the architecture of an Online Bookstore System.
We will look at this specific diagram not just as a collection of shapes, but as a story of how data moves from a user’s click all the way to a bank transaction. By using tools like Visual Paradigm, we can construct these models to ensure every interaction is accounted for before writing a single line of code.
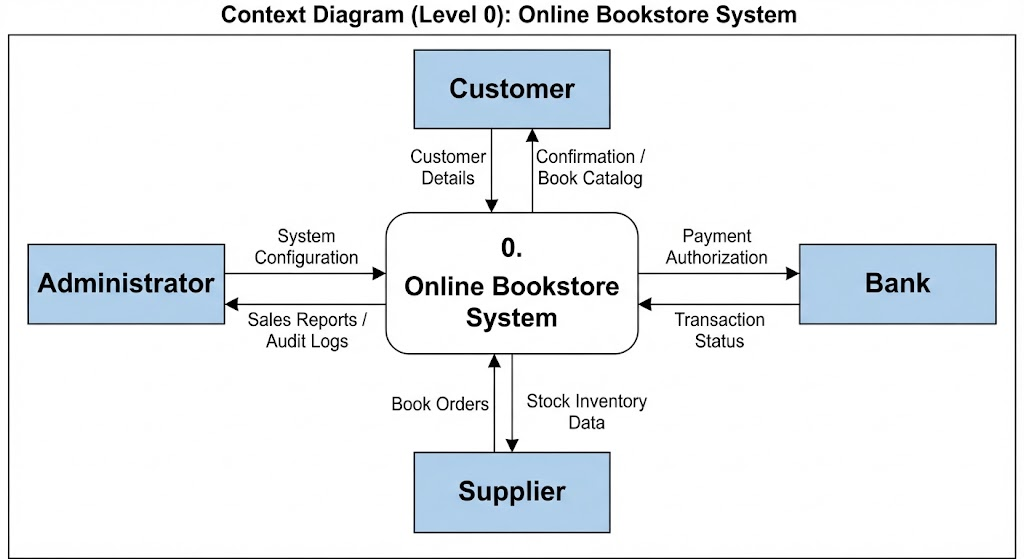
The Cast of Characters: External Entities
Every system exists within an environment, interacting with people or other systems outside its immediate control. In our bookstore model, we have four distinct external entities—represented by the blue rectangles on the perimeter:
- Customer: The primary actor who wants to buy books and manage their own account.
- Administrator: The human behind the scenes who needs to monitor sales and configure the catalog.
- Bank: An external financial institution that handles the money side of things.
- Supplier: The source of the inventory, responsible for sending new stock when orders are placed.
Think of these entities as the sources and sinks of information. They send requests into the system and receive results back out.
The Engine Room: Core Processes
In the center of the diagram, you’ll see five rounded rectangles. These represent the major processes—the active verbs of our system. Let’s break down what happens inside each one:
1.0 Manage Customer Accounts & Profiles
This is the gateway. When a customer signs up or logs in, they provide personal details. This process validates that information and writes it to our storage. It’s the foundation upon which the rest of the relationship is built.
2.0 Search & Browse Book Catalog
Once a customer is in, they need to find something to read. This process allows users to search for titles. Interestingly, notice the arrow pointing down to the Administrator? This implies that the admin also has a role here, perhaps uploading new book details or updating prices, ensuring the catalog stays fresh.
3.0 Order & Payment Processing
This is the critical moment of truth. When a customer decides to buy, this process takes the order details and the payment information. It acts as a hub, communicating with both the inventory database to check availability and the external Bank to verify funds.
4.0 Inventory Management & Supplier Orders
What happens if a book runs out? This process steps in. It manages the current stock levels and, crucially, generates orders for the Supplier when inventory gets low. It ensures the store doesn’t sell what it doesn’t have.
5.0 Sales Reporting & Administration
Finally, we have the business intelligence aspect. This process aggregates data to create sales reports. The Administrator uses these insights to make strategic decisions about marketing or purchasing.
The Memory Banks: Data Stores
A system cannot function without memory. In our diagram, the open-ended rectangles labeled D1. Customer Database and D2. Inventory Database act as our persistent storage.
You can think of these as filing cabinets. Notice the arrows connecting them to the processes. For example, Process 1.0 performs a “Write” operation to the Customer Database, while Process 3.0 performs a “Read/Update.” This bidirectional flow is essential; we aren’t just saving data; we are constantly querying it to drive the system forward.
Connecting the Dots: Data Flows
The lines connecting these elements are the lifeblood of the system. They are labeled to show exactly what information is being exchanged. For instance, look at the flow between the Bank and Process 4.0. It involves a “Payment Authorization Request” going out and a “Transaction Status” coming back in. This highlights the security checks required during a transaction.
By mapping these flows visually, we can spot potential bottlenecks or missing connections early in the design phase. If a process sends data to a place where no one is listening, the system fails. Tools like Visual Paradigm help automate some of this validation, allowing us to focus on the logic rather than just drawing lines.
Summary
In this tutorial, we explored the anatomy of an Online Bookstore System using a Level-0 Data Flow Diagram. We identified the key players (Customers, Admins, Banks, Suppliers), the core activities (Account management, Browsing, Ordering, Inventory, Reporting), and the vital data stores that hold everything together.
Understanding this high-level view is the first step toward building robust software. It transforms abstract requirements into a concrete visual model, making it easier for stakeholders to understand how the final product will behave.