Understanding the Context Diagram
Welcome to this tutorial on system modeling. Today, we are going to focus on a fundamental concept in software engineering: the Context Diagram. You might have seen these before as “Level 0” diagrams. They serve as the “bird’s eye view” of your system, defining exactly what is inside and what is outside.
In the context of our example, we are looking at a Library Borrowing System. The goal here isn’t to show every single click or button press; rather, it is to define the boundaries of the system itself and how it interacts with the outside world.
The Core Components
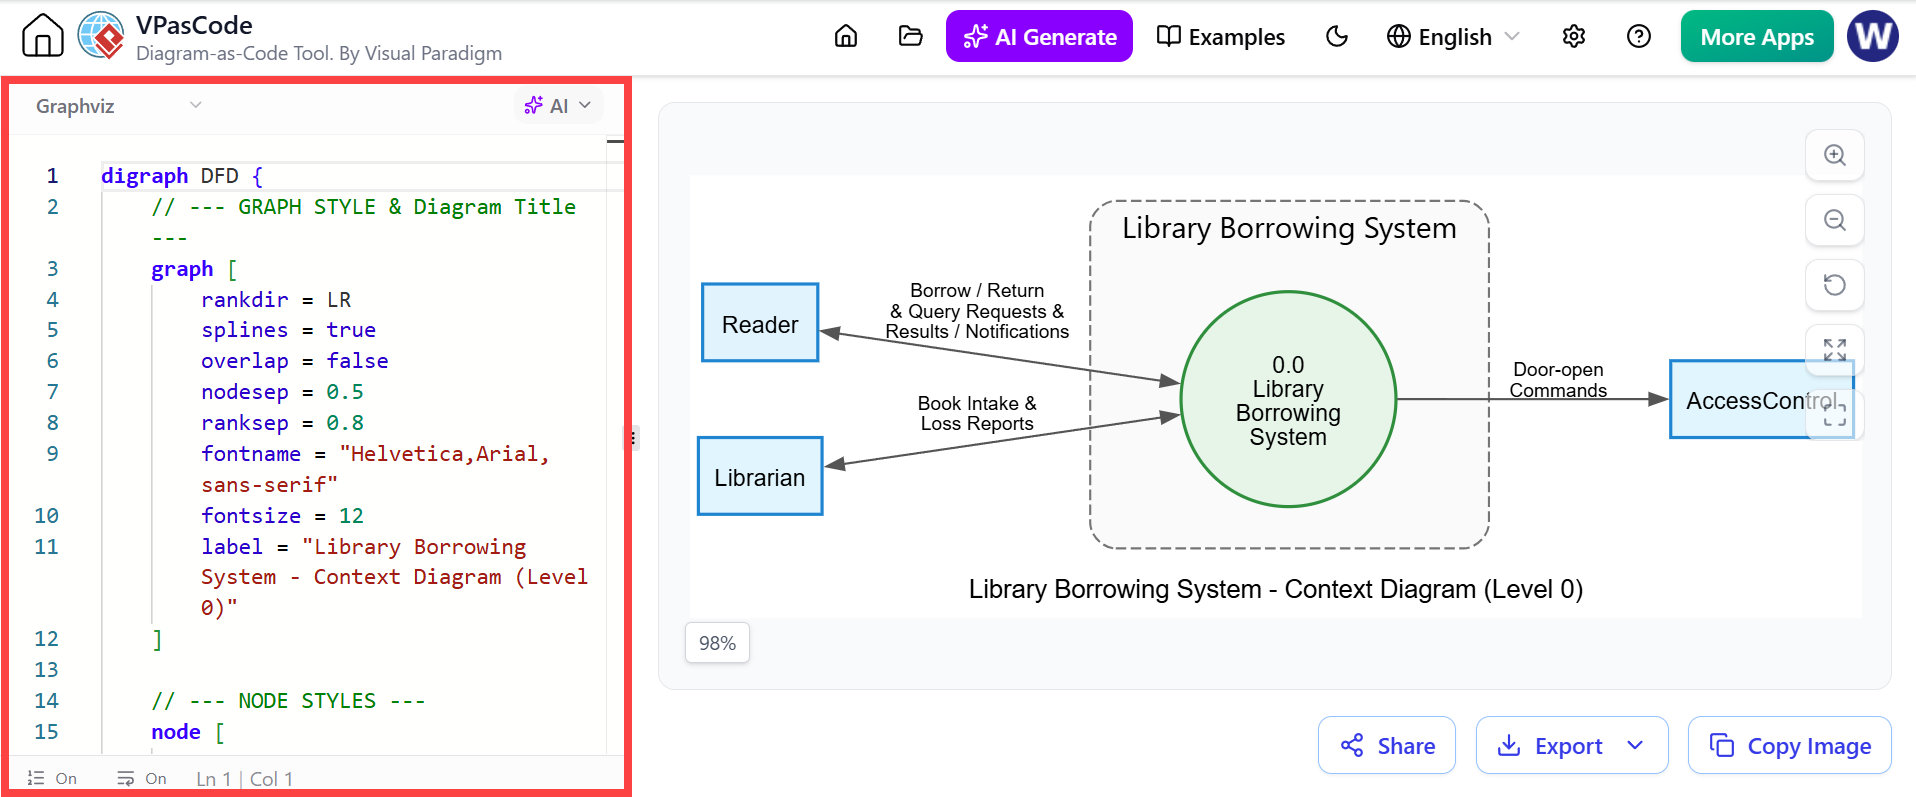
Let’s break down the diagram you see on the right side of the interface:
- The Central Process (The System): In the middle, you will see a circle labeled “0.0 Library Borrowing System.” This represents the entire application. Because it is a Level 0 diagram, we treat the whole library system as one single process.
- External Entities: Surrounding the system are blue rectangles. These represent people or other systems that interact with our library system. We have a Reader, a Librarian, and an Access Control unit.
- Data Flows: The arrows connecting these boxes are crucial. They represent data moving back and forth. For instance, the arrow between the Reader and the System indicates a two-way flow of information regarding borrowing books or receiving notifications.
From Code to Canvas: Using VPasDiag
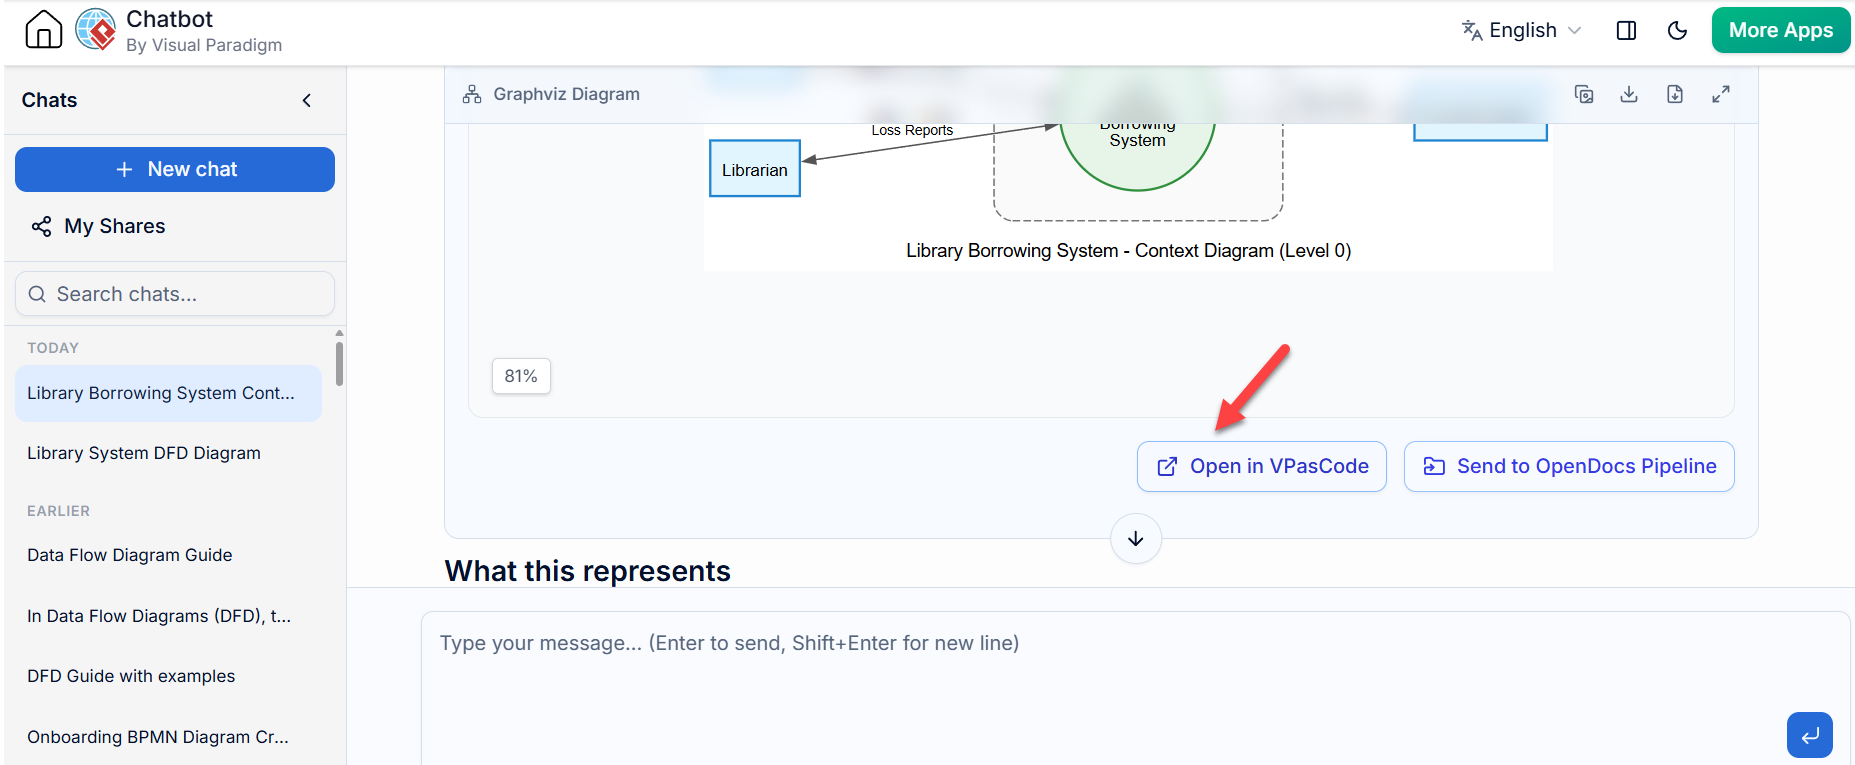
Now, let’s look at the left side of the screen. This is where the magic happens in Visual Paradigm’s VPasCode tool. Instead of dragging and dropping shapes with a mouse, which can sometimes be tedious when trying to align things perfectly, we use code. Specifically, this tool uses the Graphviz language.
This approach offers precision. When you write code, you dictate exactly how the system looks. Let’s walk through the syntax shown in the editor.
Setting the Stage
Every graph starts with a declaration. The line digraph DFD { tells the engine that we are creating a directed graph intended for a Data Flow Diagram.
Next, we define the style. Inside the graph [ ... ] block, we set global rules:
rankdir = LR: This stands for “Left to Right.” It determines the overall flow direction of the diagram, ensuring the layout reads naturally from left to right.splines = true: This ensures that our connecting lines are curved smoothly, making the diagram look more professional and easier to read.overlap = false: This is a safety feature. It instructs the engine not to let nodes overlap each other, automatically spacing them out so nothing gets hidden.
Defining the Content
As you scroll down, you’ll see comments like // --- NODE STYLES ---. Comments are vital because they help us remember what specific sections of code do without affecting the rendering.
The diagram you see visualizes a specific scenario: a library system talking to its users and hardware. By typing the code that defines the “Reader,” “Librarian,” and “Access Control” nodes, the engine instantly renders the clean, structured diagram on the right. This immediate feedback loop allows you to iterate quickly—change a label in the text box, and the diagram updates instantly.
Why Use Diagram-as-Code?
You might wonder why we don’t just draw everything manually. While drawing is intuitive, managing complex diagrams can become messy. Using code (Diagram-as-Code) brings several advantages:
- Version Control: Just like source code, diagrams can be saved in Git repositories. You can track changes over time and revert mistakes easily.
- Consistency: Coding enforces strict formatting rules, ensuring your diagrams always look uniform.
- Speed: Once you know the syntax, generating a complex network or system architecture is often faster than clicking and dragging.
Summary of Key Learnings
To wrap up this session, remember these three points:
- A Context Diagram provides a high-level overview of a system, showing only the main interactions with external entities.
- VPasCode allows you to leverage the power of Graphviz syntax directly within Visual Paradigm to generate these diagrams programmatically.
- Using code for modeling improves collaboration, version control, and consistency in your documentation workflow.