Have you ever started a software project with a client who had “vague” ideas? You might have spent weeks writing documents that nobody read, only to find yourself in a cycle of rework when the final product didn’t quite match their vision. This is a common struggle for system analysts and developers alike.
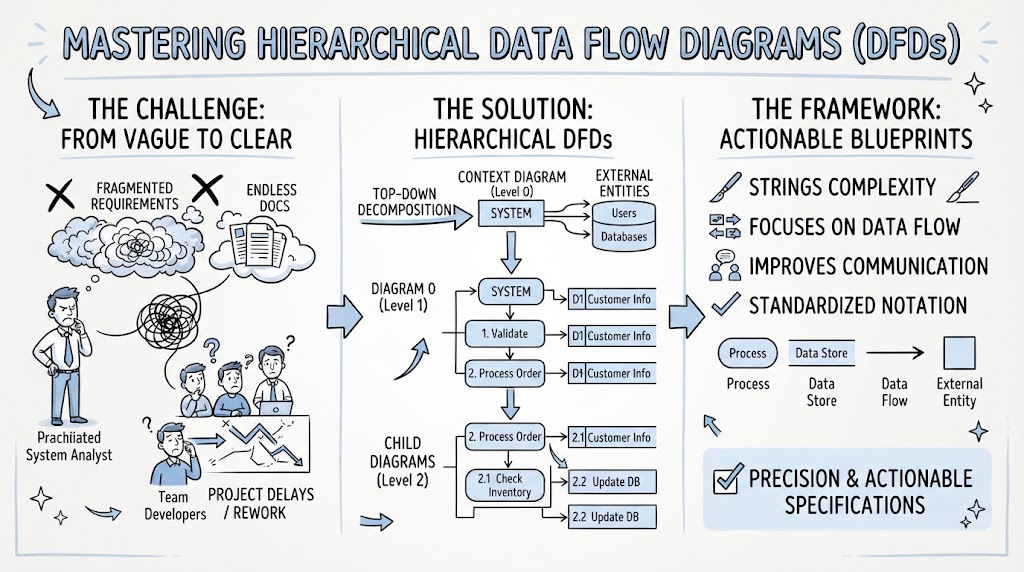
The image we are looking at today represents a journey from this chaotic state to clarity. It illustrates the power of using Hierarchical Data Flow Diagrams to structure complex information. Let’s walk through this process step-by-step, just as you would deconstruct a problem in Visual Paradigm.
The Challenge: From Vague to Clear
Imagine you are a System Analyst standing on the left side of our diagram. Your head is full of a tangled mess of thoughts—fragmented requirements. On the right, your team of developers looks equally confused, staring at endless documentation or a downward-trending graph labeled “Project Delays.”
This disconnect happens because human brains struggle to hold too many details at once. When you try to explain a massive system in one go, the message gets lost. The result is confusion, delays, and rework. To fix this, we need a tool that allows us to break things down without losing the big picture.
The Solution: Hierarchical DFDs
The middle section of our diagram introduces the solution: Top-Down Decomposition. Instead of trying to draw every single detail immediately, we start broad and drill down. This is the essence of creating a Hierarchical DFD.
Level 0: The Context Diagram
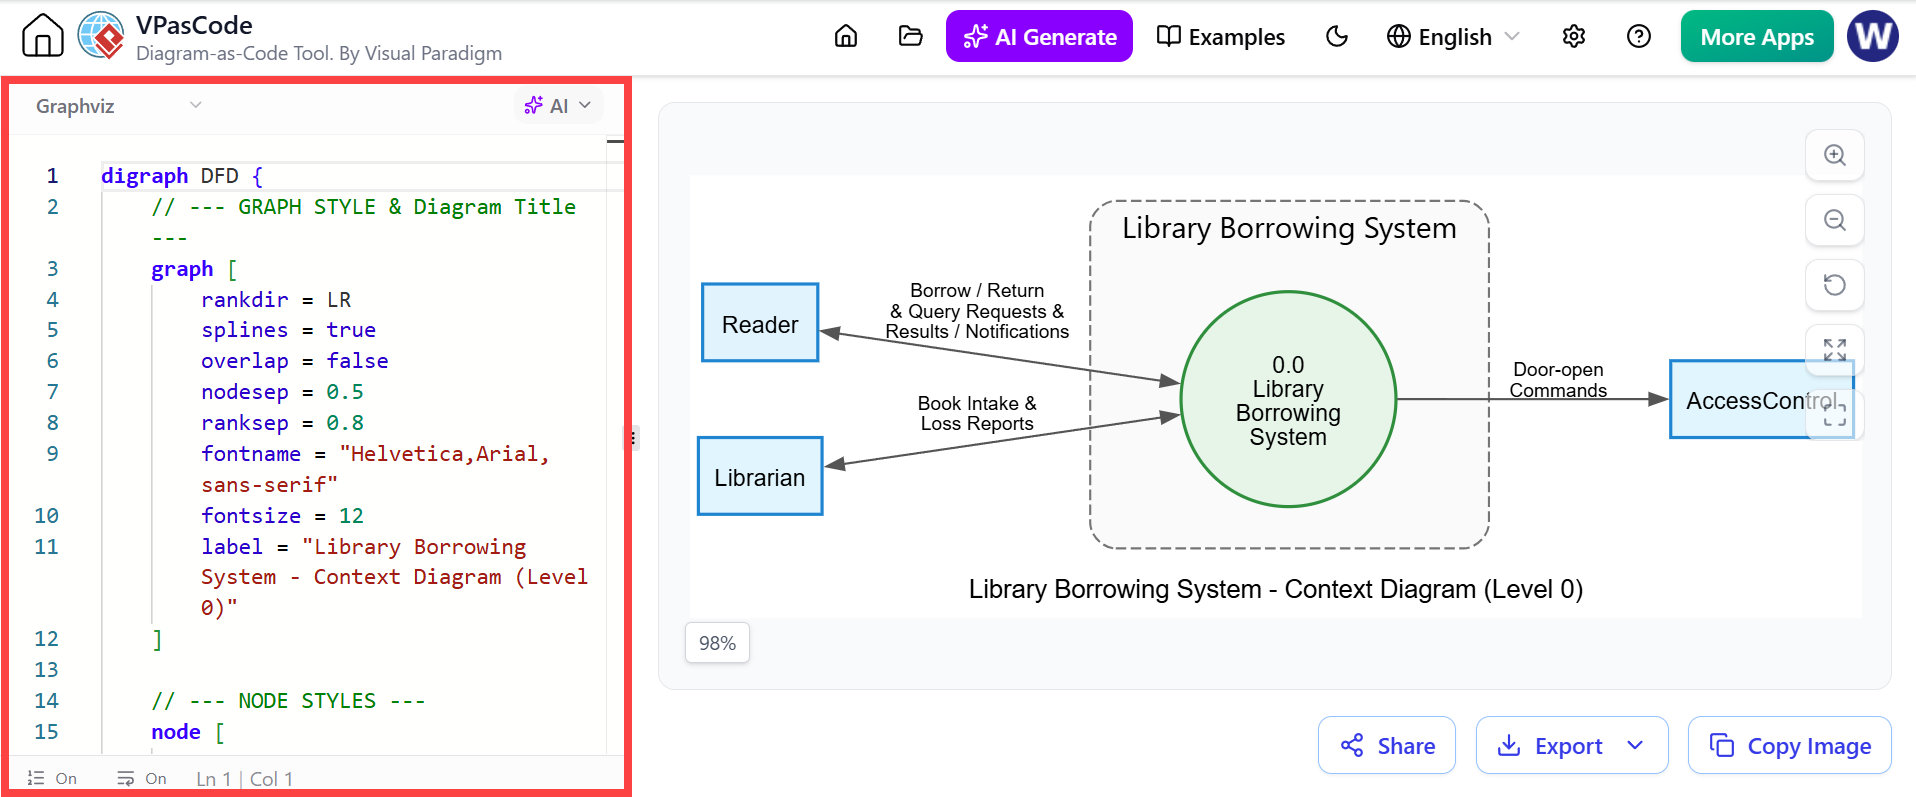
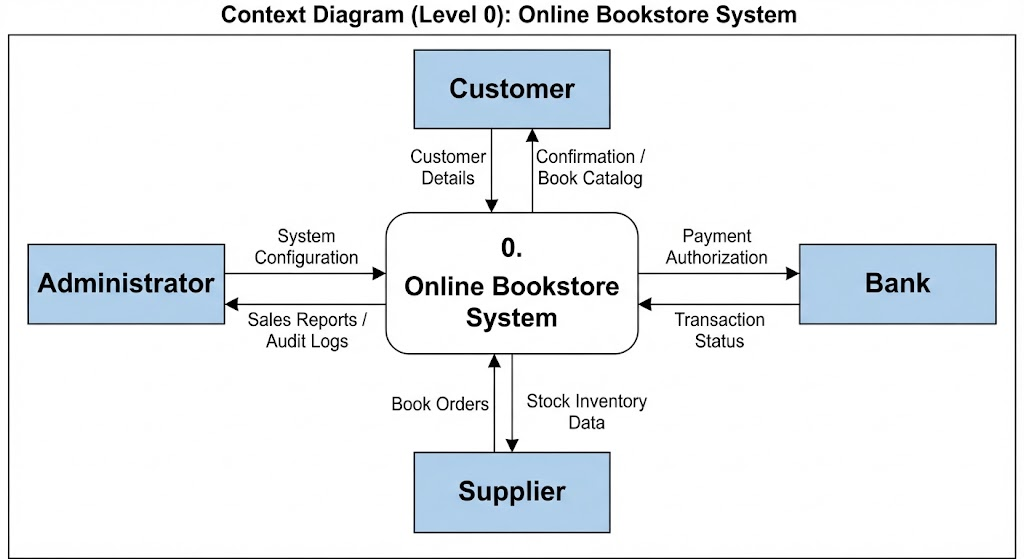
We begin at the top with the Context Diagram, also known as Level 0. Think of this as the “helicopter view.” In this view, the entire system is represented as a single bubble or process box. We simply define what data enters the system from External Entities (like Users or Databases) and what data leaves it.
- Goal: Define the boundaries of the system.
- Visual: One central box interacting with external entities.
Level 1: Diagram 0
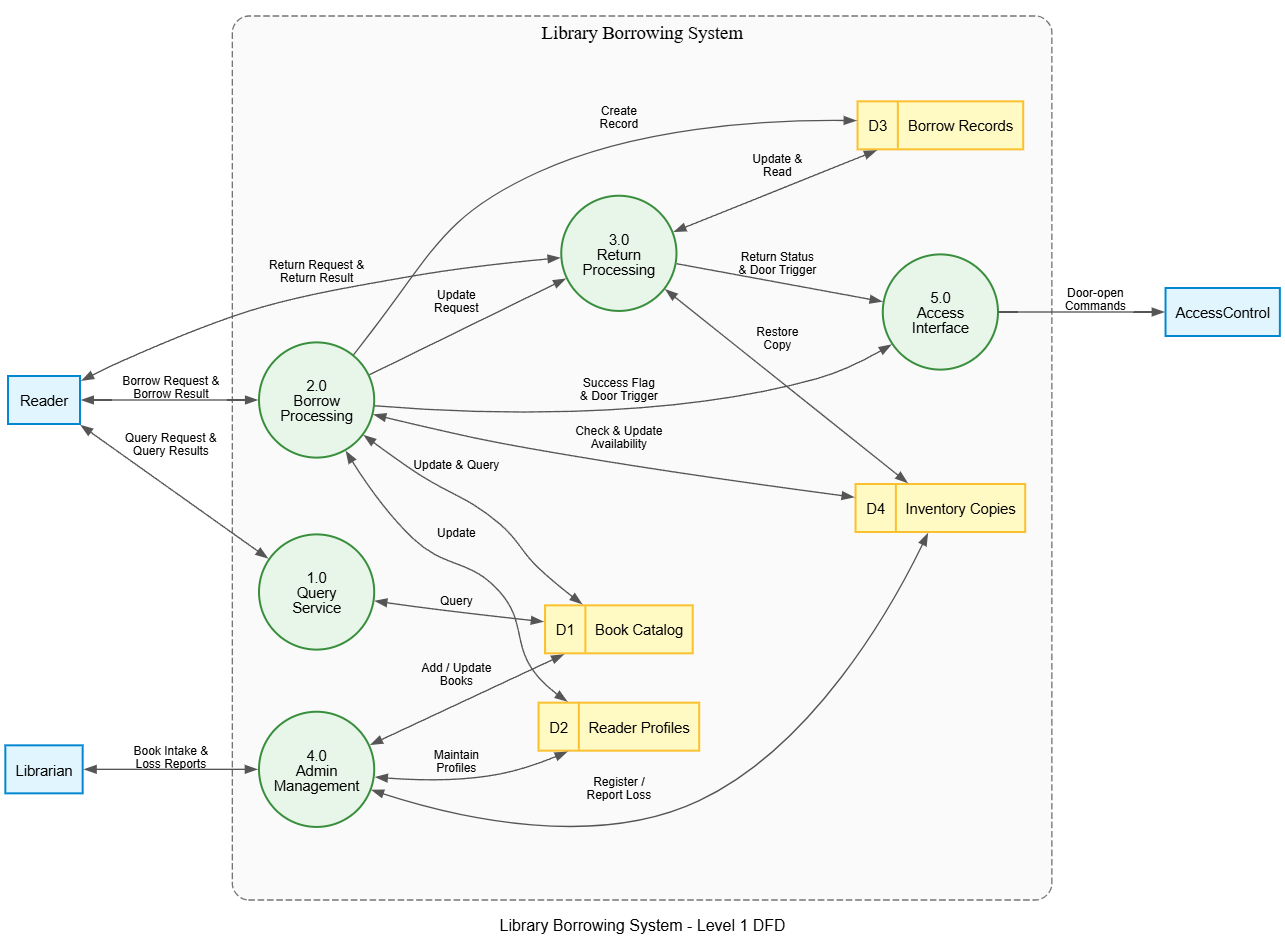
Once the boundaries are set, we “explode” that single bubble into its major sub-processes. This creates Diagram 0 (or Level 1). If the system was “Order Processing,” Level 1 might show three main bubbles: Validate Order, Process Payment, and Ship Goods. This gives the team a high-level roadmap of how data flows through the major stages.
Level 2: Child Diagrams
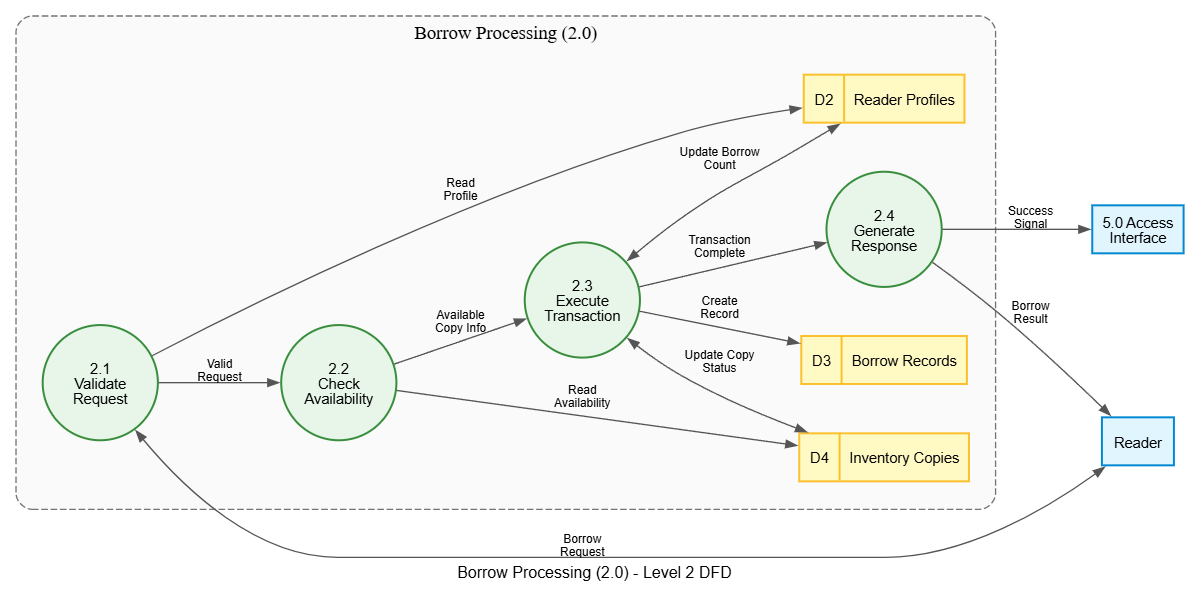
Finally, we take those specific processes from Level 1 and expand them further. For example, if we look closely at the “Process Order” bubble, we can create a child diagram (Level 2) that breaks it down even more. Here, we might see steps like “Check Inventory” and “Update Database.”
This is where Visual Paradigm shines. Its ability to link these diagrams allows you to maintain this hierarchy effortlessly. You don’t have to redraw everything; you simply click on a process to drill down into its children, ensuring that the relationship between the high-level view and the detailed logic remains intact.
The Framework: Actionable Blueprints
Why do we bother with all these levels? The right side of the diagram highlights the benefits of this framework. By using a standardized notation, we achieve several key goals:
- Strings Complexity: We aren’t trying to manage the whole monster at once. We handle complexity piece by piece.
- Focus on Data Flow: Unlike flowcharts that focus on logic loops, DFDs focus strictly on where data comes from and goes to.
- Improved Communication: Stakeholders can understand the Context Diagram easily, while developers can dive into the Child Diagrams for technical specs.
Ultimately, this leads to precision and actionable specifications. Everyone—from the analyst to the developer—is looking at the same blueprint, just zoomed in at different levels.
Summary
In conclusion, moving from vague requirements to a solid plan requires structure. Hierarchical Data Flow Diagrams provide that structure through top-down decomposition. By starting with a Context Diagram and drilling down into Level 1 and Level 2 details, you transform a confusing tangle of requirements into a clear, navigable map. Whether you are sketching on a whiteboard or modeling in Visual Paradigm, this approach ensures your team stays aligned and your projects stay on track.