


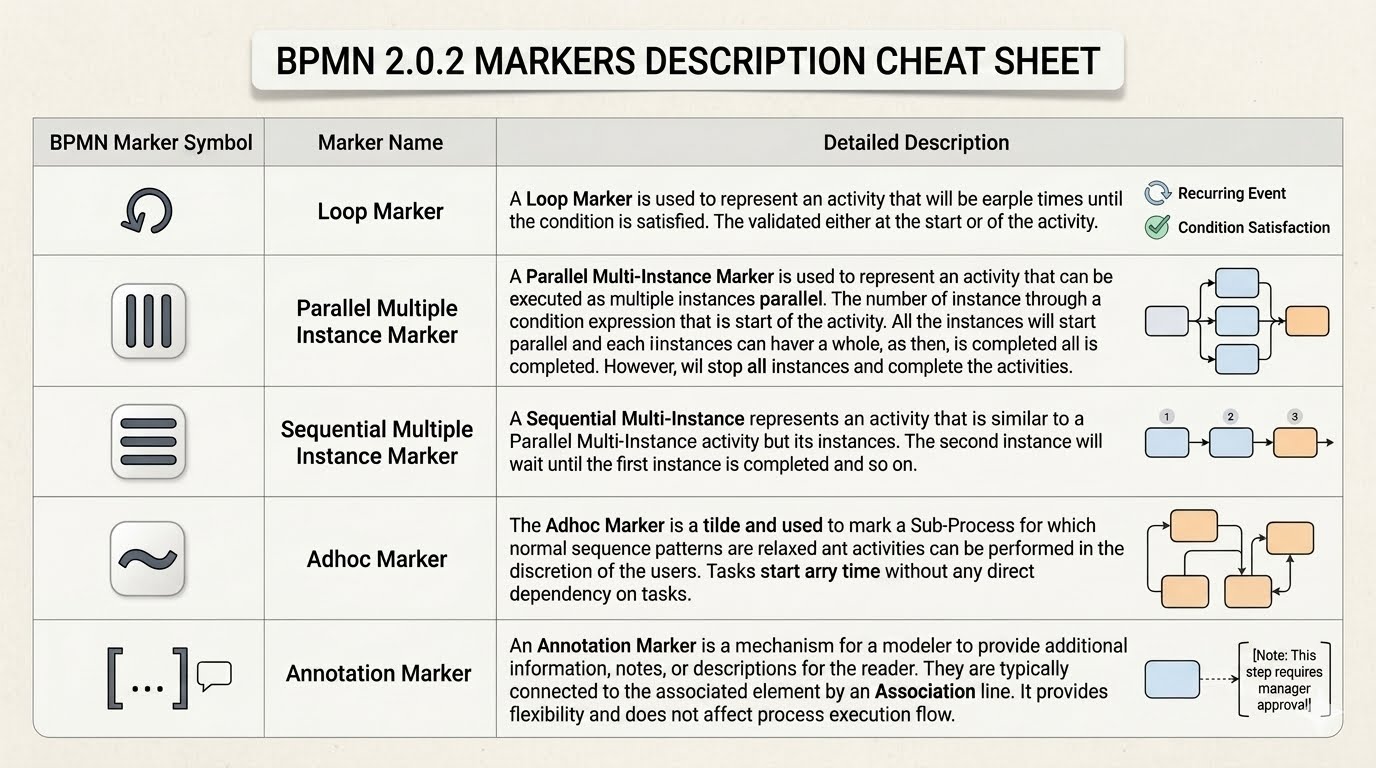
In the world of Business Process Model and Notation (BPMN), many beginners quickly grasp the foundational elements: Tasks (the work), Gateways (the decisions), and Events (the triggers). However, a critical layer of logic often gets overlooked: Markers. These small, powerful symbols act as “modifiers” that sit inside an activity shape to fundamentally change how that task behaves. Without them, a process diagram might look correct structurally but fail to capture critical execution logic—such as whether a task repeats, runs in parallel, or allows for human discretion.
This guide breaks down the five essential BPMN 2.0 markers, explains their technical implications, and demonstrates how to implement them efficiently.
1. The Loop Marker: Controlling Repetition
The Loop Marker is perhaps the most intuitive of the markers, serving a function similar to a while loop in programming. It represents an activity that will repeat a specific number of times until a condition is met.
Visual Identification
Look for a circular arrow icon inside the activity box.
Execution Logic
When a process reaches a task with a Loop Marker, the system does not simply move to the next step. Instead, it enters a cycle. There are two primary ways to configure this loop:
- Condition Satisfaction: The task repeats until a specific condition evaluates to true. For example, a “Verify Login” task might loop until the user enters the correct password.
- Recurring Event: The task is triggered by an event that occurs repeatedly, such as a time-based schedule (e.g., “Generate Daily Report”).
2. Parallel Multiple Instance Marker: Scaling Execution
The Parallel Multiple Instance Marker is used when a single task needs to be executed multiple times simultaneously. This is the BPMN equivalent of a fork operation in operating systems or a Promise.all() call in JavaScript.
Visual Identification
Identified by three vertical bars stacked inside the activity shape.
Execution Logic
When the process flow hits a task with this marker, the system creates multiple instances of that task. These instances run in parallel, meaning they happen at the exact same time.
- Start Condition: This defines how many instances are created. For example, “Create one instance for every order in the queue.”
- Completion Condition: This defines when the task is considered “done.” The process waits until all instances are completed before moving to the next gateway.
Real-world example: A “Process Order” task where 50 orders arrive simultaneously. The system spawns 50 parallel instances of the processing task.
3. Sequential Multiple Instance Marker: The “For” Loop
While the parallel marker handles simultaneous work, the Sequential Multiple Instance Marker handles work that must happen one after another, similar to a for loop in coding.
Visual Identification
Identified by three horizontal bars stacked inside the activity shape.
Execution Logic
This marker creates multiple instances of the task, but unlike the parallel marker, the second instance will not start until the first instance is completed. This ensures a strict order of operations.
- Order of Execution: Instance 1 runs -> finishes -> Instance 2 runs -> finishes -> Instance 3 runs.
- Completion: The task is complete only after the final instance has finished execution.
Real-world example: A “Send Invitation” task where invitations must be sent one by one to avoid overwhelming the email server, or a step-by-step training module that requires completion of Module 1 before Module 2 starts.
4. The Adhoc Marker: Freedom of Action
The Adhoc Marker (represented by a tilde ~) is used to mark a Sub-Process where the normal sequence patterns are relaxed. It allows for a high degree of flexibility and human discretion.
Visual Identification
Identified by a tilde (~) symbol inside the activity shape.
Execution Logic
In a standard process, tasks must happen in a specific order defined by sequence flows. In an Adhoc Sub-Process, tasks can be performed in any order and at any time. There are no strict dependencies forcing one task to wait for another.
- Task Start: Tasks can start any time without direct dependency on previous tasks.
- Completion: The sub-process is only considered complete when all contained tasks have been executed, regardless of the order in which they were done.
Real-world example: A “Troubleshoot Error” sub-process. A technician might check the power source, check the network cable, or reboot the system in any order they choose, as long as the error is resolved.
5. The Annotation Marker: Adding Context
The Annotation Marker is unique because it does not affect process execution flow. It is a mechanism for a modeler to provide additional information, notes, or descriptions for the reader.
Visual Identification
Identified by a bracketed ellipsis [\u2026] or a speech bubble connected to the element.
Execution Logic
This marker provides flexibility without changing logic. It is typically connected to the associated element by an Association line. It is perfect for adding complex rules, legal disclaimers, or technical constraints that would clutter the visual flow of the diagram.
Example: A note attached to a “Approve Loan” task stating: “Note: This step requires manager approval if the amount exceeds $10,000.”
Implementation with Visual Paradigm
Implementing these markers correctly is crucial for accurate process modeling. Using tools like Visual Paradigm simplifies this process. Visual Paradigm provides a dedicated “Marker” palette within the BPMN 2.0 toolbar.
For advanced users, Visual Paradigm’s AI-assisted modeling features can even help generate these markers automatically based on natural language descriptions. For instance, if you type “Process 100 orders in parallel,” the AI can suggest adding a Parallel Multiple Instance Marker to your “Process Order” task, ensuring your model accurately reflects the intended business logic.
Conclusion
Understanding BPMN markers is the bridge between a simple flowchart and a robust executable process model. By mastering the Loop, Parallel, Sequential, Adhoc, and Annotation markers, you ensure that your diagrams capture not just what is happening, but how it is happening.
Related posts:
 Understanding Mortgage Application Flows with BPMN
 Understanding Process Improvement: An “As-Is” Analysis of Apex Manufacturing Inc.
 Mastering BPMN Collaboration: A Guide to Cross-Platform Modeling with Visual Paradigm Online
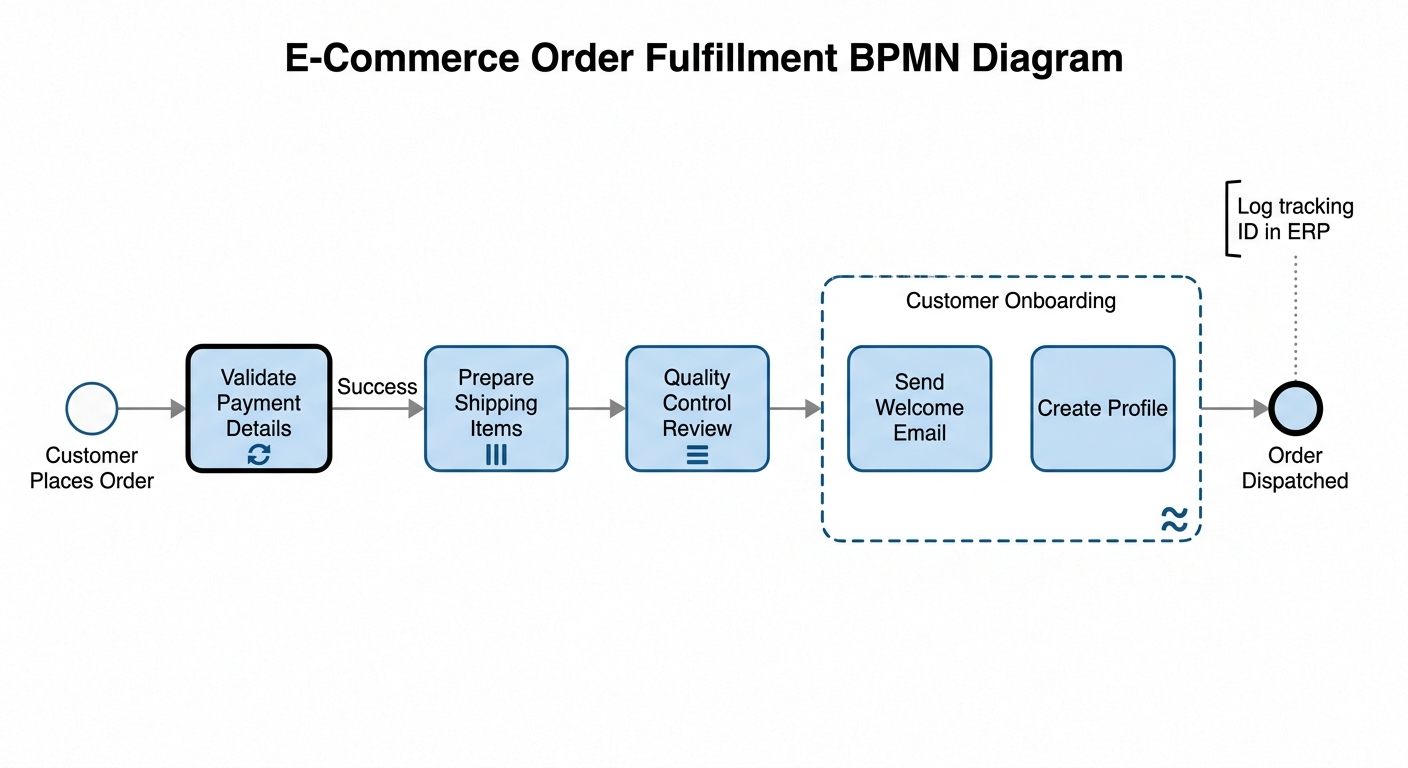 Mastering BPMN Markers: A Technical Deep Dive into E-Commerce Order Fulfillment