In the world of Business Process Management, the difference between a simple flowchart and an executable business model often comes down to a single detail: the Event. Events are the heartbeat of any BPMN (Business Process Model and Notation) diagram. While Tasks describe the work being done, Events describe the reality of the business environment—the triggers, the delays, and the conclusions.
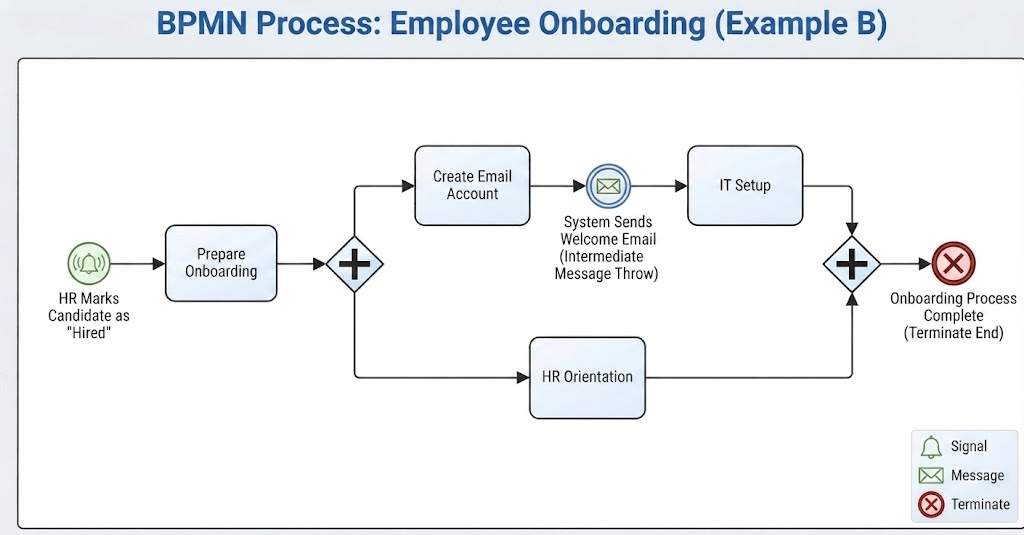
In this tutorial, we will dissect Example B: Employee Onboarding. This diagram is a perfect case study for understanding how to leverage different types of events to create robust, precise process models. We will walk through the architecture step-by-step, exploring how signals, messages, and terminators drive the lifecycle of a new hire.
1. The Trigger: Signal Start Event
Every process needs a moment of ignition. In BPMN, this is represented by a Start Event. In our onboarding example, we see a specific type of start event: the Signal Start.
- Visual Identification: Notice the circle with a bell icon inside. In BPMN standards, a signal event is often depicted with a bell or a lightning bolt to indicate an asynchronous occurrence.
- Functional Logic: A “Signal Start” implies that the process is triggered by an occurrence in the broader environment, rather than a direct manual entry. As described in the context, this event is “Triggered when HR marks a candidate as ‘Hired’ in the system.”
- Why use it? Using a Signal Start allows the onboarding process to exist independently until the specific condition (the hire) is met. It captures the moment the candidate officially enters the company ecosystem.
2. The Convergence: Parallel Gateway
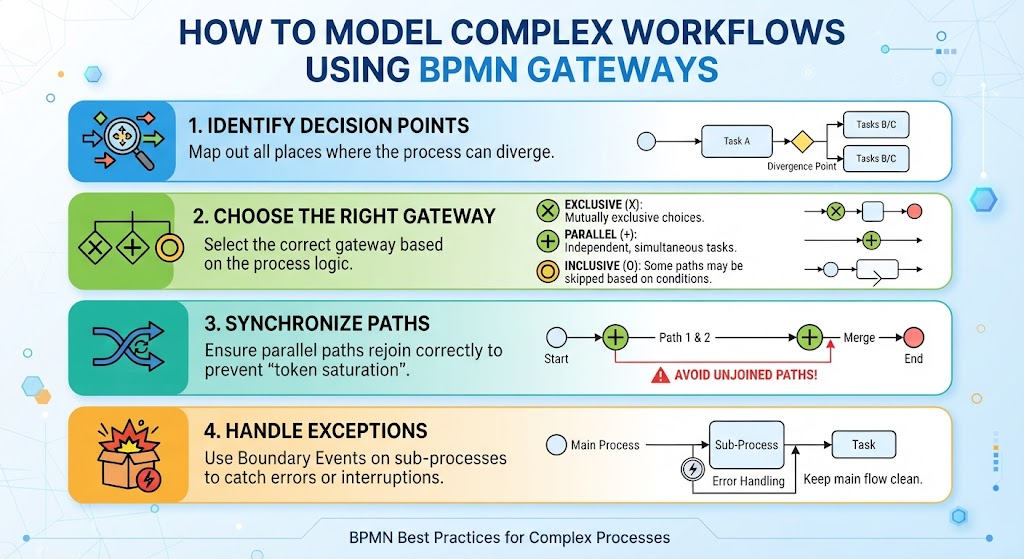
Once the process is triggered, we move to the Prepare Onboarding task. Following this, the diagram features a diamond shape with a plus sign (+). This is a Parallel Gateway.
This is a critical architectural decision. It dictates that the process splits into two simultaneous paths. The system does not wait for one task to finish before starting the other; both branches initiate immediately. This is why we see:
- Path A: Creating the email account and setting up IT.
- Path B: HR Orientation.
3. The Interaction: Intermediate Message Throw
Let’s examine the top branch of our diagram. After the Create Email Account task, we encounter an Intermediate Message Throw.
- The Concept: Intermediate events happen between the start and the end. In this specific case, it is a “Throw” event, meaning the process sends data out to another entity.
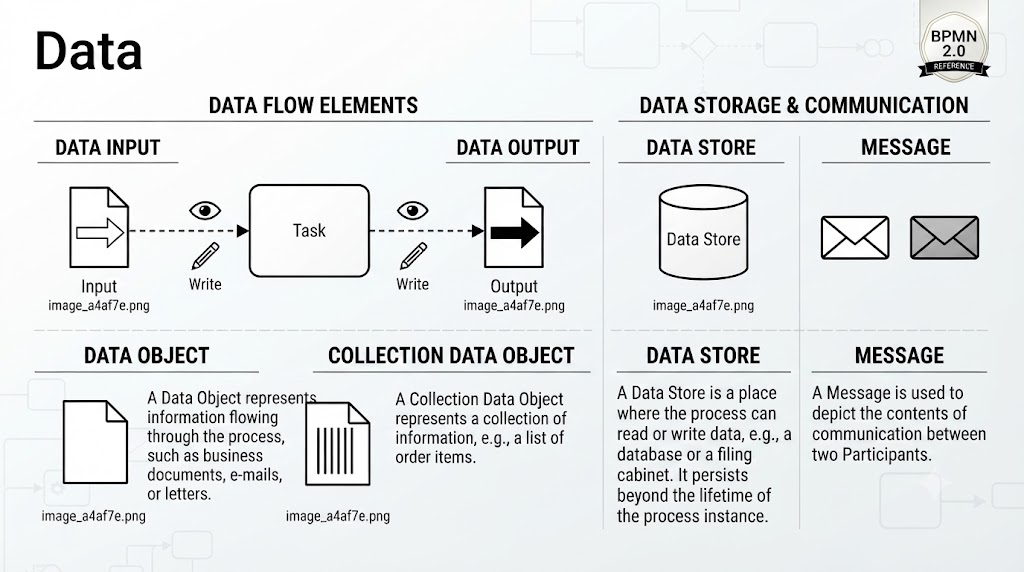
- Visual Identification: This is represented by a circle containing an envelope icon. The legend confirms this symbolizes a Message.
- The Business Context: The diagram notes: “System Sends Welcome Email.” This is a perfect example of a system-to-human interaction. The process pauses briefly to ensure the email is generated and sent (thrown) before moving to the next technical task, IT Setup.
4. The Synchronization and Conclusion: Parallel Gateway & Terminate End
The process flows through IT Setup and HR Orientation. Eventually, these two parallel paths meet again at a second Parallel Gateway. This second gateway acts as a synchronizer; it waits for both the IT setup and the HR orientation to complete before allowing the flow to proceed.
Once synchronized, the process hits its conclusion:
The Terminate End Event
The process ends at a circle with a red “X” inside. This is a Terminate End event.
- Visual Identification: The thick red circle with the cross is the universal symbol for termination.
- Business Meaning: This signifies the successful and final completion of the entire onboarding lifecycle. The text “Onboarding Process Complete” confirms that the state of the process is now “Closed.”
- Why Terminate? Unlike a regular End Event (which just marks the end of a path), a Terminate End implies that the entire process instance is killed. No further activities or sub-processes should continue once this point is reached.
Key Takeaways: From Flowcharts to Engineering
By mastering the distinction between the thin, double, and thick circles (Start, Intermediate, and End events), and leveraging tools like Visual Paradigm to implement them correctly, you move from drawing simple flowcharts to engineering precise, executable business models.
Remember the golden rule provided in our context: If something happens to the process, it’s likely an Event. Whether it is a signal ringing in, a message being sent, or the process being terminated, these events provide the necessary context to make your BPMN diagrams truly powerful.