


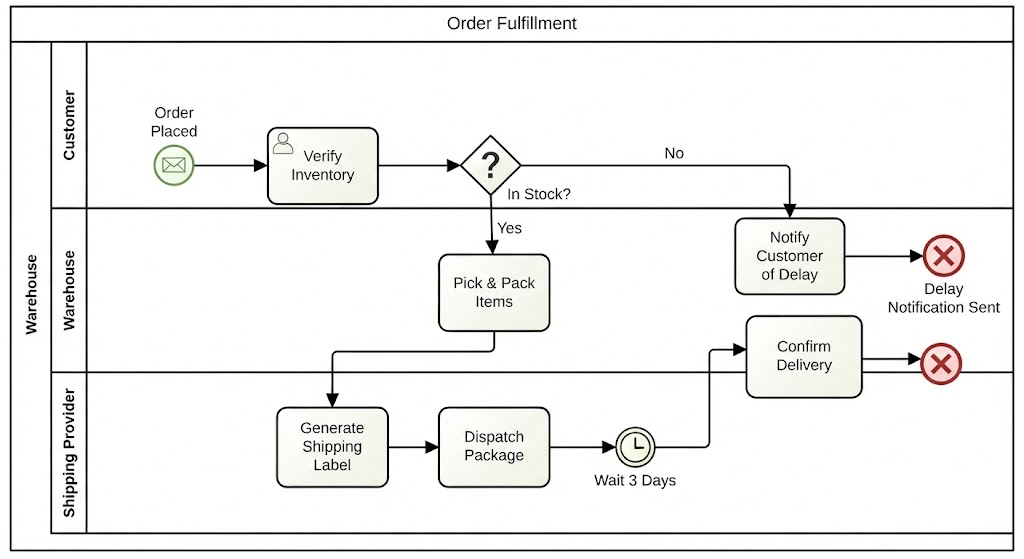
In the realm of enterprise architecture and process modeling, few visual languages are as powerful or universally understood as Business Process Model and Notation (BPMN). This tutorial dissects a complex real-world scenario: Online Order Fulfillment. By analyzing the swimlane diagram provided, we will explore how technical systems, human roles, and logical decision-making converge to create a robust operational workflow.
This guide is designed to walk you through the system architecture step-by-step, transforming a static diagram into a dynamic understanding of how modern e-commerce logistics operate under the hood.
1. The Concept of Swimlanes: Organizing Complexity
Before diving into the specific actions, we must understand the structural foundation of this diagram: Swimlanes. In system architecture, context is everything. A process diagram can become a “spaghetti diagram” of chaos without proper boundaries. Swimlanes solve this by visually segregating the process into distinct functional areas.
In our Order Fulfillment scenario, the diagram is partitioned into three distinct Roles:
- Customer: The initiator of the process. This lane represents the external trigger and the user experience.
- Warehouse: The inventory management and physical handling core. This is where the “business logic” of stock availability lives.
- Shipping Provider: The logistical execution arm responsible for moving goods.
This segregation allows architects to identify bottlenecks. For instance, if the “Warehouse” lane is consistently slower than the “Shipping Provider,” we know exactly where to invest in automation.
2. The Trigger: Start Events
Every system needs a catalyst. In BPMN, this is represented by a Start Event. The diagram depicts a Message Start Event (indicated by the envelope icon) labeled “Order Placed.”
From a technical standpoint, this is not merely a “click” on a website. It represents an asynchronous message entering the system boundary. This event triggers the workflow engine, initializing the data context for the subsequent tasks. It is the moment data transitions from the frontend (customer) to the backend (order processing).
3. Logic and Decision Making: Gateways
The heart of any automated system is its decision-making logic. The diagram introduces this via a Exclusive Gateway (the diamond shape labeled “In Stock?”).
This symbol represents a binary decision point. The process flow splits based on a condition:
- The “Yes” Path (Normal Flow): Inventory is confirmed. The system proceeds to execute the physical fulfillment.
- The “No” Path (Exception Handling): Inventory is missing. The system diverts to an exception handling task (“Notify Customer of Delay”).
Key Architectural Insight: Notice the End Event (the red circle with an X) connected to the “No” path. This is an Terminate End Event. It signifies that if the stock is unavailable, the current order process terminates immediately. The system does not waste resources waiting for a shipment that cannot happen.
4. Task Execution and Handoffs
The rectangular boxes in the diagram represent Tasks. In this architecture, tasks are often assigned to different actors:
- Verify Inventory: A logical check against the database.
- Pick & Pack Items: A physical task performed by warehouse staff or robots.
- Generate Shipping Label: A document generation task, often automated by the Warehouse system communicating with the Shipping Provider’s API.
- Dispatch Package: The physical handover to the logistics carrier.
The arrows connecting these tasks are called Sequence Flows. They dictate the strict order of operations. The flow from “Pick & Pack” to “Generate Shipping Label” implies a handoff where the packing status must be confirmed before the label can be printed.
5. Intermediate Events: The Wait Logic
Real-world processes rarely happen instantaneously. The diagram includes a critical component for handling time: the Intermediate Catching Event (the circle with a clock).
Labeled “Wait 3 Days,” this event acts as a pause in the process flow. In system terms, this might be a scheduled job or a timeout mechanism. The system cannot move to the “Confirm Delivery” task until this timer has elapsed. This prevents premature status updates and ensures that the data reflects the reality of transit times.
6. Conclusion: The Complete Picture
By the end of this process, we reach the End Event labeled “Order Complete.” The successful execution of this diagram ensures that a customer receives their goods, inventory is managed, and exceptions are handled gracefully.
This diagram is more than a flowchart; it is a blueprint for software development. It tells the developer what APIs to build (e.g., for inventory checks), what state machines to implement (e.g., for the shipping delay), and how to structure the database to track the lifecycle of an order.
Related posts:
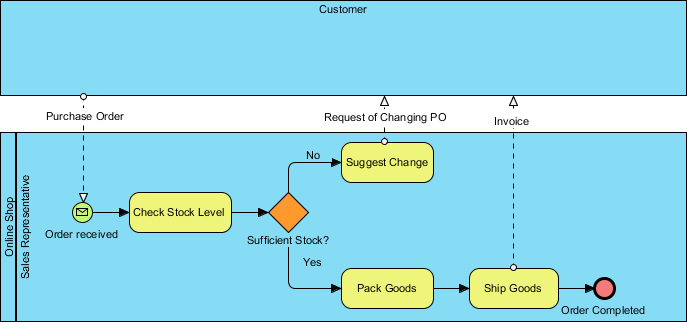 Online Shop Sales Representative Order Process Flow Diagram
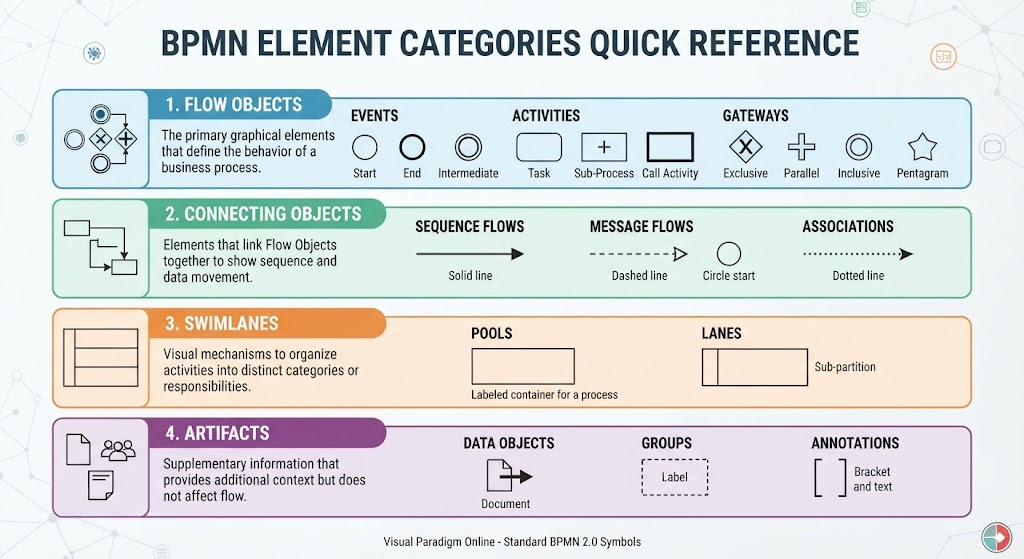 Mastering BPMN: A Comprehensive Guide to Element Categories and Modeling Logic
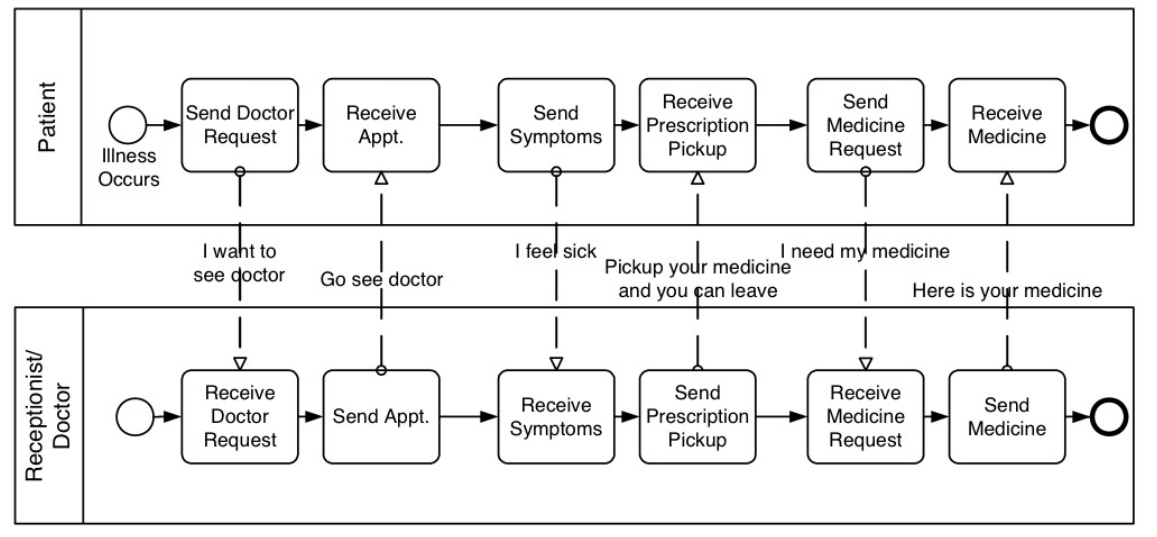 Mastering BPMN Collaboration Diagrams: A Step-by-Step Guide to Modeling Multi-Party Interactions
 Building Agile Workflows: A Guide to AI-Driven BPMN Modeling in Visual Paradigm