In today’s fast-paced business environment, understanding and optimizing workflows is critical for organizational success. Business Process Modeling (BPM) serves as a powerful technique to visualize, analyze, and improve how work gets done within an organization. By representing business activities, information flows, and decision logic in a clear visual format, BPM enables stakeholders to communicate effectively, identify bottlenecks, and drive continuous improvement.
This comprehensive tutorial will guide you through the fundamentals of business process modeling using Visual Paradigm, a robust platform within the Visual Paradigm ecosystem. Whether you are a business analyst, process owner, or project manager, you will learn how to create professional-grade Business Process Model and Notation (BPMN) diagrams that capture both current (“as-is”) and future (“to-be”) states of your processes.
Phase 1: The Strategic Foundation
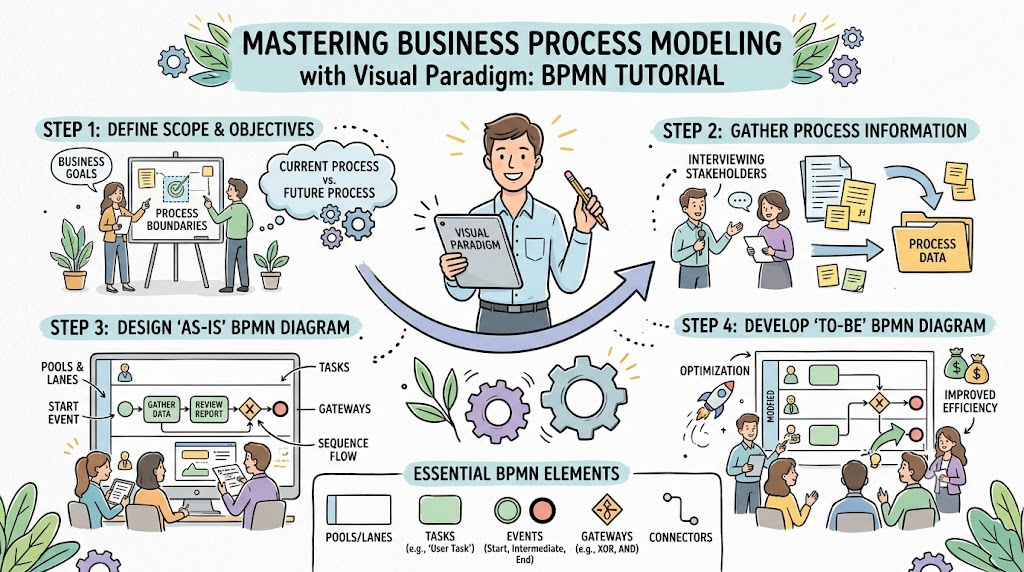
Step 1: Define Scope & Objectives
Before opening any modeling software, the foundation of a successful process model lies in clear definition. This initial phase is about setting the boundaries of your project.
- Business Goals: Clearly articulate what the organization hopes to achieve. Are you trying to reduce costs, improve speed, or ensure compliance?
- Process Boundaries: Determine where the process starts and where it ends. A common pitfall is defining a scope that is too broad; focus on a specific, manageable slice of the business.
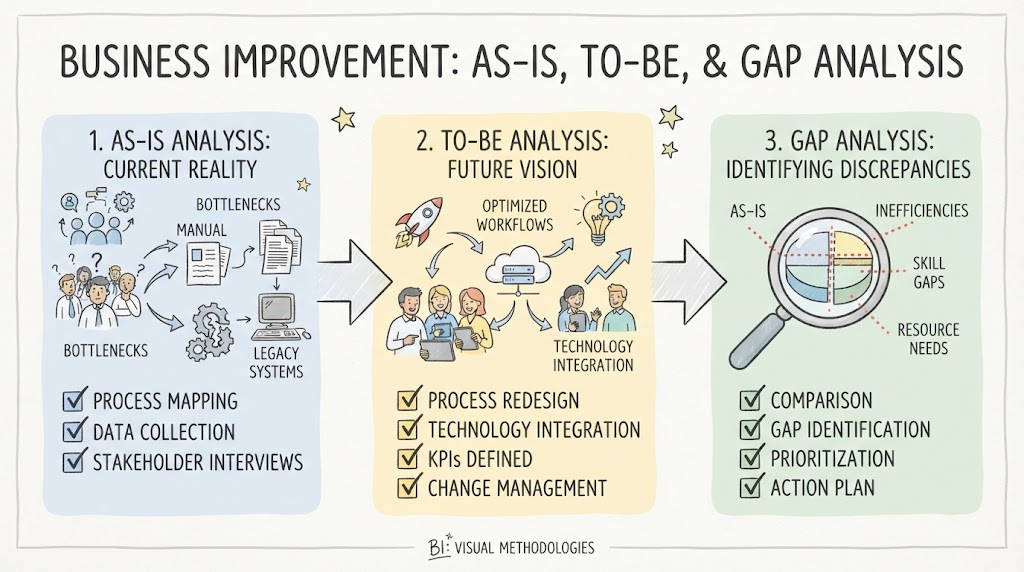
- Current vs. Future State: Visual Paradigm allows you to model the “As-Is” (current reality) and the “To-Be” (target future) simultaneously. Understanding the gap between these two states is the primary driver of value.
Step 2: Gather Process Information
Once the scope is set, you must gather the raw data required to build your model. This is a collaborative phase involving the people who actually do the work.
- Interviewing Stakeholders: Speak with employees, managers, and customers. Ask questions about how they handle exceptions, what tools they use, and where they feel friction in the current system.
- Collecting Process Data: Gather existing documentation, such as standard operating procedures (SOPs), forms, and legacy diagrams. This “Process Data” serves as the factual basis for your initial diagrams.
Phase 2: Modeling the ‘As-Is’ State
Step 3: Design ‘As-Is’ BPMN Diagram
Now, you translate the gathered information into a visual language using Visual Paradigm. The “As-Is” diagram represents the process exactly as it happens today, flaws and all. This is crucial for identifying bottlenecks.
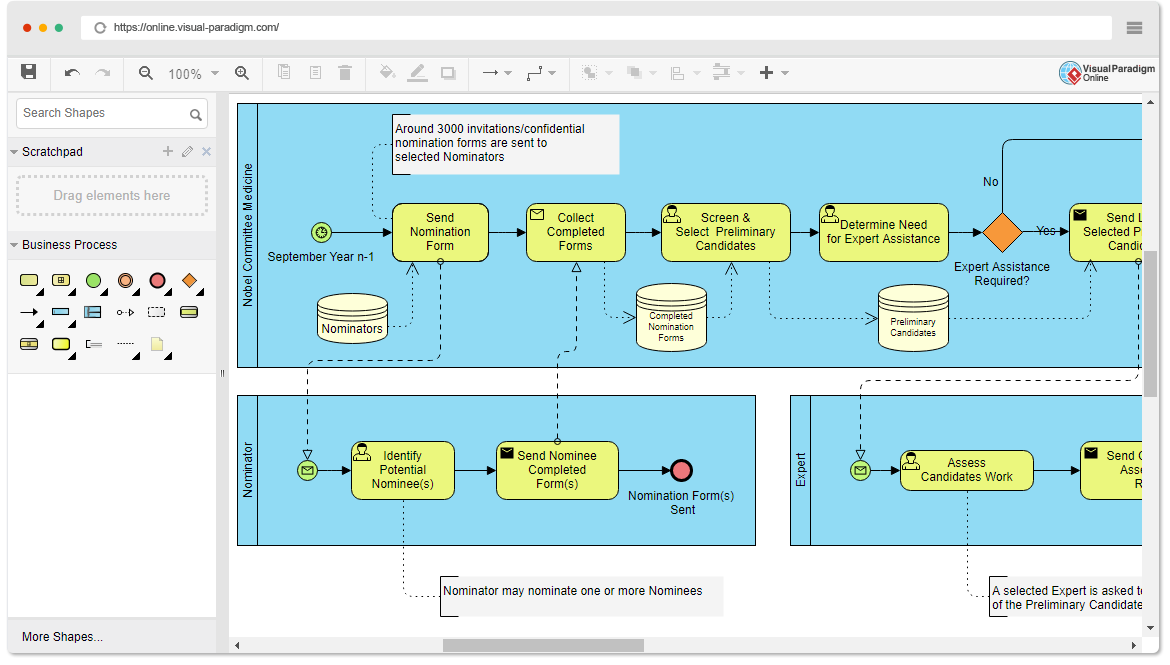
When building this diagram in Visual Paradigm, you will utilize the following core components:
- Pools & Lanes: These represent the major participants in the process. A Pool represents the entire organization or a distinct business entity, while Lanes within a pool represent specific roles, departments, or systems (e.g., “Sales Dept,” “Customer,” “ERP System”).
- Start Event: The trigger that initiates the process (e.g., a “Receive Order” circle). In BPMN, this is typically a green circle.
- Tasks: The actual work being performed. In Visual Paradigm, these are represented by rounded rectangles. You can create User Tasks (work done by people) and Service Tasks (work done by systems).
- Gateways: These control the flow of the process. The diamond shape usually indicates a decision point where the path splits based on a condition (e.g., “Is order value > $1000?”).
- Sequence Flow: The arrows connecting the elements, indicating the order in which activities occur.
Phase 3: Optimizing for the Future
Step 4: Develop ‘To-Be’ BPMN Diagram
With the “As-Is” process documented and analyzed, you can now design the ideal future state. The “To-Be” diagram is where the magic of optimization happens.
This phase involves:
- Optimization: Use the rocket icon concept to symbolize rapid improvement. Remove unnecessary steps, automate manual tasks, and streamline decision paths.
- Improved Efficiency: Redesign the flow to minimize wait times and reduce errors. Visual Paradigm allows you to simulate these changes to see if the new process actually works before implementing it in the real world.
- Validation: Review the new diagram with stakeholders to ensure it aligns with the original business goals defined in Step 1.
Appendix: Essential BPMN Elements Cheat Sheet
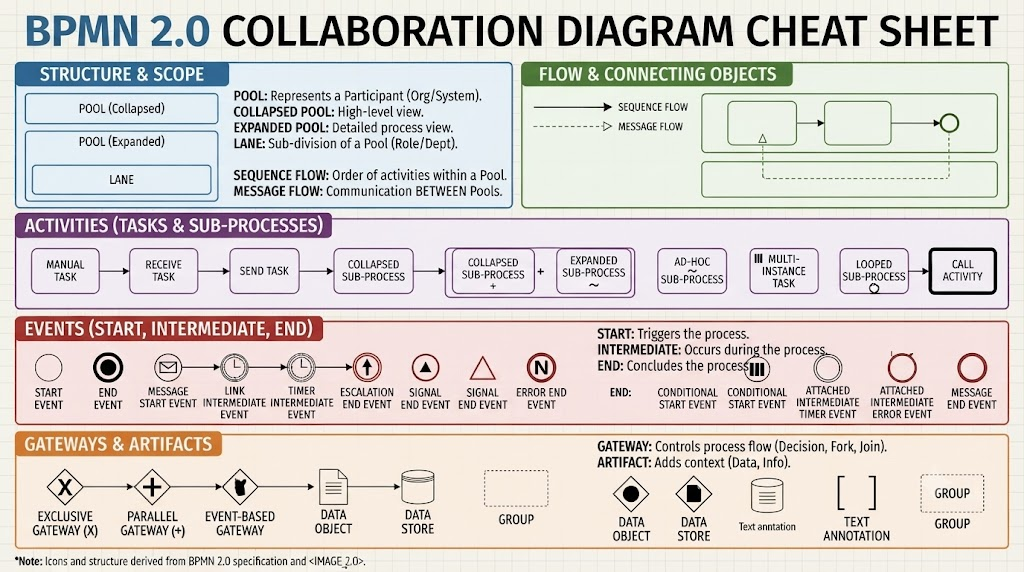
To effectively use Visual Paradigm, you must understand the standard notation used in BPMN 2.0. Here is a quick reference guide to the symbols you will encounter:
- Pools/Lanes: Containers that organize the diagram by participant.
- Tasks: The specific work units (e.g., User Task, Service Task, Manual Task).
- Events: Things that happen during the process.
- Start Event: The beginning (Green Circle).
- Intermediate Event: Something that happens in the middle (Yellow Circle).
- End Event: The conclusion (Red Circle).
- Gateways: Logic controllers that determine branching paths (e.g., XOR for exclusive choices, AND for parallel splits).
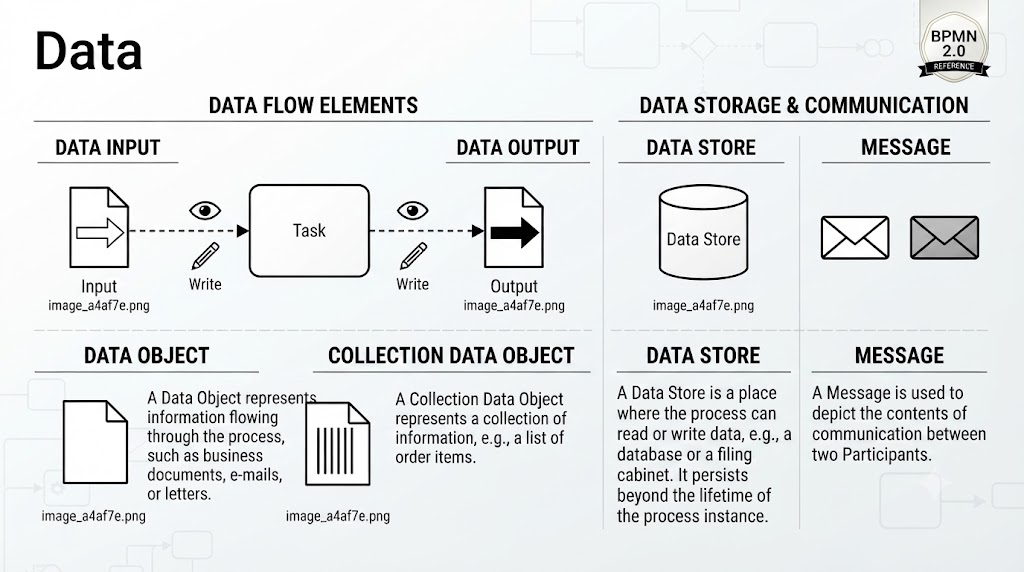
- Connectors: The lines (Sequence Flows, Message Flows, Associations) that link elements together.