In the world of Business Process Model and Notation (BPMN), while many focus on the detailed internal steps of a single process, the Conversation Diagram offers a crucial macro-level perspective. It is designed to give you a high-level understanding of the relationships and interactions between different participants (pools) within a specific domain.
Whether you are modeling a complex supply chain, a multi-party legal agreement, or a software system integration, understanding how different entities communicate is vital. This tutorial will guide you through the architecture of BPMN Conversation Diagrams and walk you through creating your first one using Visual Paradigm.
Understanding the Core Architecture
Unlike a standard BPMN Flowchart which focuses on the sequence of activities within a single organization, a Conversation Diagram abstracts the details. It focuses on what is being discussed or agreed upon between parties rather than how the work is done internally.
The architecture relies on two primary components:
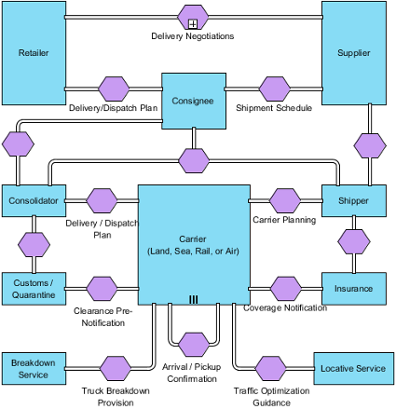
- Pools (Participants): These represent the external entities involved in the conversation. In the logistics example provided, these include the Retailer, Supplier, Consignee, and Carrier.
- Conversation Nodes: Represented by hexagonal shapes, these nodes define the specific topics, agreements, or data exchanges occurring between the participants. Examples include Delivery Negotiations, Shipment Schedule, or Carrier Planning.
Step-by-Step: Creating a Conversation Diagram in Visual Paradigm
Visual Paradigm offers a robust environment for creating these diagrams. Follow these steps to initiate your modeling session:
- Initiate the Diagram: Navigate to the application toolbar and select
Diagram>New. - Select the Type: In the New Diagram window, locate and select Conversation Diagram.
- Configure Details: Click
Next. You will be prompted to enter a name and description for your diagram. This is an excellent place to document the scope of the business domain you are modeling. - Location: The Location field enables you to select the specific model file where this diagram will be stored.
- Finalize: Click
OKto generate the blank canvas.
Case Study: Analyzing a Complex Logistics Domain
To truly understand the power of this diagram type, let us analyze the provided image, which depicts a complex logistics and shipping environment. This diagram demonstrates how multiple parties interact simultaneously without needing to clutter the view with internal process details.
1. The High-Level Negotiation Phase
At the very top of the diagram, we see a direct relationship between the Retailer and the Supplier. They are connected via a conversation node labeled Delivery Negotiations. This single hexagon represents a critical agreement that likely precedes any physical movement of goods.
2. The Role of the Consignee
The Consignee acts as a central hub. Notice how they interact with the Supplier via a Shipment Schedule node. This indicates that the party receiving the goods is actively involved in planning when goods will arrive, highlighting a collaborative supply chain model.
3. The Carrier Ecosystem
The largest pool in the center is the Carrier (Land, Sea, Rail, or Air). This diagram effectively shows the Carrier’s complexity. They are not just moving goods; they are managing:
- Planning: Interacting with the Shipper via Carrier Planning.
- Logistics: Coordinating with the Consolidator via Delivery/Dispatch Plan.
- Compliance: Handling Clearance Pre-Notification with Customs/Quarantine.
- Insurance: Managing risk through Coverage Notification.
Why Use Conversation Diagrams?
By abstracting the internal mechanics, Conversation Diagrams offer several strategic advantages:
- Stakeholder Alignment: They allow business stakeholders to see the “big picture” without getting bogged down in technical process details.
- Gap Analysis: They make it easy to spot missing interactions. For instance, if the Locative Service pool is isolated, you know immediately that there is no defined communication path for traffic optimization.
- Scalability: You can model interactions across multiple organizations (Retailer, Supplier, Third-Party Logistics) on a single canvas.
Mastering the Conversation Diagram in Visual Paradigm allows you to map the intricate web of agreements that drive modern business operations, ensuring that every participant is on the same page before the work begins.