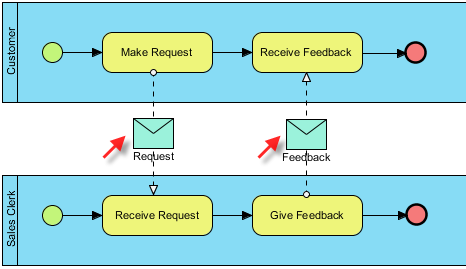
In the realm of system architecture and business process management, understanding how distinct entities communicate is just as critical as understanding what they do individually. This tutorial breaks down a specific Business Process Diagram (BPD) that visualizes the exchange of information between two distinct roles: a Customer and a Sales Clerk.
By analyzing this diagram, we learn how to model Message Flows—the dashed lines that represent the transmission of data or documents between separate lanes or pools in a process.
1. Understanding the Structure: Swimlanes and Actors
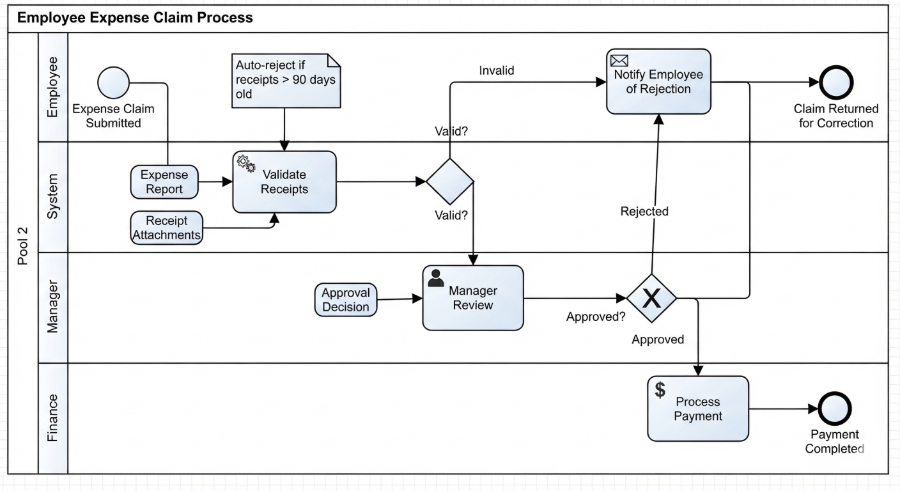
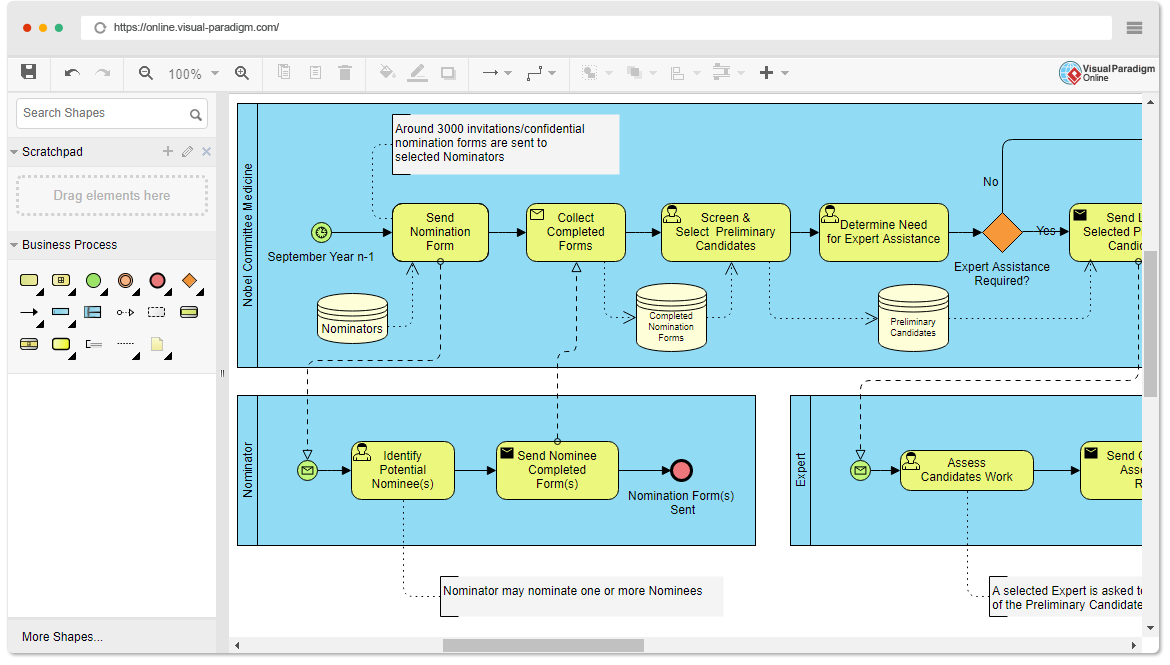
The diagram is organized into horizontal partitions known as Swimlanes. Each lane represents a specific actor or role responsible for executing tasks within that section. This visual separation is crucial for assigning responsibility.
- The Customer Lane (Top): This lane represents the external client initiating the process. It contains the tasks where the customer makes a request and waits for a response.
- The Sales Clerk Lane (Bottom): This lane represents the internal service provider. It contains the tasks where the clerk receives the request and provides the necessary feedback.
Each lane begins with a Start Event (a green circle) and concludes with an End Event (a red circle with a thick border), indicating the lifecycle of the process for that specific actor.
2. The Core Concept: Sequence Flow vs. Message Flow
A common point of confusion in process modeling is distinguishing between tasks that happen in a sequence and messages that are passed between actors. This diagram highlights two distinct types of connections:
Sequence Flow (Solid Lines)
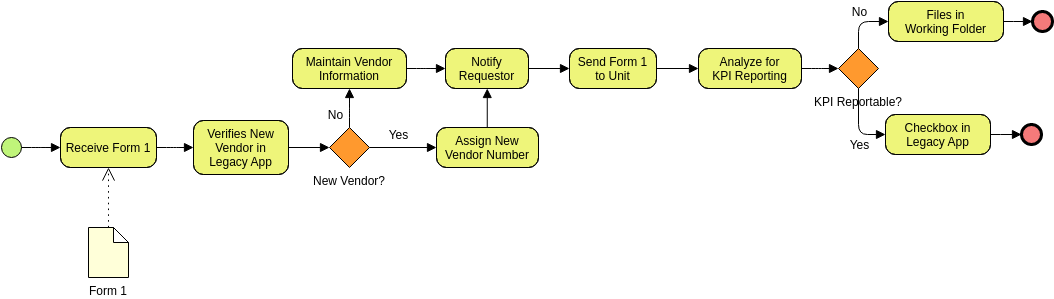
Inside each lane, you will see solid black arrows connecting the green start circle to the yellow tasks, and the tasks to the red end circle. These represent Sequence Flow. They dictate the order of operations within a single actor’s workflow.
Message Flow (Dashed Lines & Envelopes)
The most critical part of this diagram is the interaction between the lanes. You will see dashed lines connecting the Customer lane to the Sales Clerk lane. These are Message Flows.
In this specific visualization, the message is not just an abstract line; it is modeled as a tangible object—a green envelope with a label (e.g., Request or Feedback). This explicitly shows that a specific piece of data is being created by one actor and consumed by the other.
3. Step-by-Step Walkthrough of the Process
Let’s trace the lifecycle of a single interaction as depicted in the diagram:
- Initiation: The process begins in the Customer lane. The customer performs the task
Make Request. - The Outbound Message: Once the request is made, a message flow is triggered. A dashed line extends from the “Make Request” task downwards, pointing to a message object labeled
Request. This signifies that the request data is being generated and prepared for transmission. - The Handoff: The dashed line continues from the
Requestenvelope into the Sales Clerk lane, connecting to the taskReceive Request. This indicates that the message has successfully traversed the boundary between the two actors and is now available for the clerk to process. - Processing: The Sales Clerk performs their internal tasks (not fully detailed here, but implied) and reaches the task
Give Feedback. - The Return Message: The clerk generates a response. A dashed line extends upwards from “Give Feedback” to a message object labeled
Feedback. - Completion: The dashed line continues from the
Feedbackenvelope back into the Customer lane, connecting to the taskReceive Feedback. The customer’s process then moves to the End Event.
4. Technical Takeaways for System Architects
When designing systems based on this model, several architectural principles emerge:
- Asynchronous Communication: The use of message flows implies that the Customer does not wait synchronously for the Clerk’s response. The process for the Customer pauses at “Receive Feedback” until the message arrives.
- Loose Coupling: By explicitly modeling the message objects, we see that the Customer and Sales Clerk are loosely coupled. They only interact via the defined data contracts (
RequestandFeedback), allowing the internal logic of each lane to change without breaking the overall process. - Visibility: This diagram provides a high-level view of system integrations. In a software context, the dashed lines represent API calls, database triggers, or email notifications that bridge two different system modules.
By mastering these visual conventions, you can create clear, actionable blueprints that bridge the gap between business requirements and technical implementation.