


In the fast-paced world of Agile software development, the ability to visualize complex workflows is as critical as the code itself. While Agile methodologies emphasize rapid delivery and collaboration, they still rely heavily on clear process definitions, particularly at integration points and compliance stages. One of the most powerful tools for achieving this clarity is the Swimlane Diagram (or Cross-Functional Flowchart).
This tutorial explores the architecture of process modeling using Swimlanes, breaking down three distinct usage cases that demonstrate how to map Cross-Functional Feature Delivery, Customer Journeys, and Incident Response protocols. By the end of this guide, you will understand how to structure these diagrams to optimize team efficiency.
Understanding the Swimlane Architecture
Before diving into specific scenarios, it is essential to understand the underlying structure of a Swimlane diagram. Unlike a standard flowchart, a Swimlane diagram adds a spatial dimension that represents responsibility and ownership.
- The Pool: This represents the boundary of the process or the organization involved (e.g., “The Company” or “The Customer”).
- The Lanes: These are sub-divisions within a pool that represent specific roles, departments, or systems (e.g., “Front-End Dev” or “Monitoring System”).
- The Flow: Arrows moving vertically within a lane represent internal processing steps. Arrows moving horizontally between lanes represent handoffs or data transfers between different entities.
Case Study A: Cross-Functional Feature Delivery
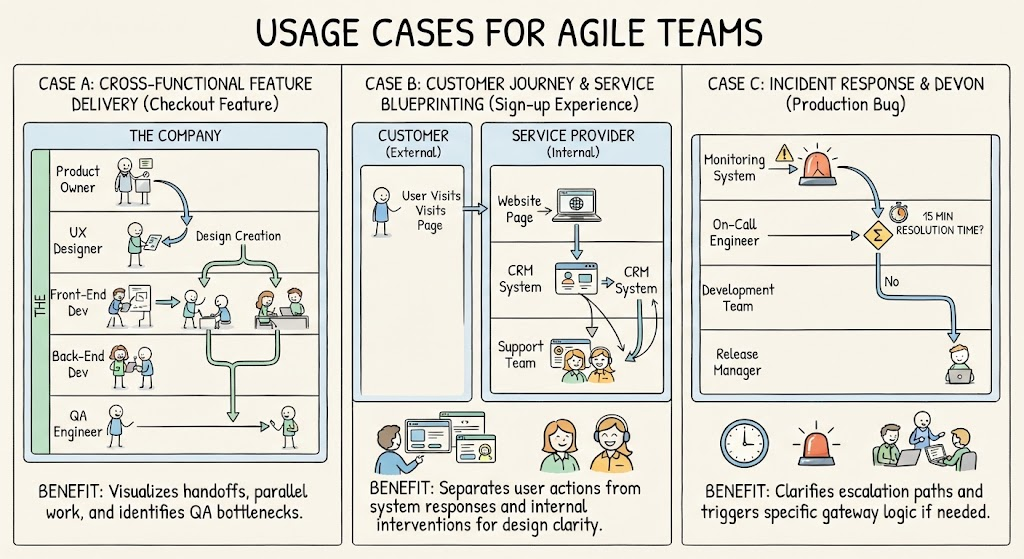
The first scenario illustrates how an Agile squad delivers a new feature, specifically a checkout feature. This diagram highlights the interplay between creative roles, technical roles, and quality assurance.
Structuring the Workflow
In this model, the process is contained within a single pool labeled “The Company.” The lanes are organized hierarchically by role:
- Product Owner: The process initiates here. The Product Owner defines requirements, initiating the flow into the design phase.
- UX Designer: This lane handles “Design Creation.” The diagram shows a handoff from the Product Owner to the Designer, visualizing the translation of requirements into visual blueprints.
- Front-End Dev & Back-End Dev: Once the design is complete, the flow splits into parallel lanes. This is a crucial architectural decision in Agile modeling. By placing Front-End and Back-End developers in separate lanes, the diagram visualizes that these teams can work concurrently on the feature, rather than sequentially.
- QA Engineer: The parallel streams eventually converge at the QA lane. This visual convergence represents the “Integration Point.”
The Architectural Benefit
The primary benefit of this architecture is the identification of bottlenecks. In the diagram, notice how the arrows from the developers funnel into the QA Engineer. If the QA lane is visually smaller or the arrows are congested, it immediately signals that the Quality Assurance process is being bottlenecked by late code commits. This visibility allows teams to adjust their workflow—perhaps by implementing earlier integration testing—to maintain the Agile velocity.
Case Study B: Customer Journey & Service Blueprinting
The second scenario expands the scope beyond a single organization to the entire service ecosystem. This is known as Service Blueprinting.
Dual Pool Architecture
Unlike Case A, this diagram utilizes two pools to represent the relationship between an external entity and an internal provider:
- Pool 1: Customer (External) – This lane represents the user’s actions, such as “User Visits Page.”
- Pool 2: Service Provider (Internal) – This pool contains the internal systems and teams that respond to the customer’s actions.
Mapping the Interaction
The magic of this diagram lies in the horizontal lines connecting the two pools. This is often called the Line of Interaction.
- Front Stage: The “Website Page” is directly visible to the customer. The diagram shows the user visiting the page, which triggers a system response.
- Back Stage: Once the user interacts, the flow moves into the internal lanes of the CRM System and Support Team. These processes happen behind the scenes.
The Architectural Benefit
This architecture ensures that the team designs for both usability and operational efficiency. It clearly separates what the user sees (Front Stage) from the complex data manipulation required to support them (Back Stage). For example, if a user clicks a button, the diagram helps architects understand that while the user sees a simple click, the internal CRM system might need to perform a multi-step data retrieval process.
Case Study C: Incident Response & DevOps
The final scenario shifts from product development to operational stability. This is a classic DevOps Incident Response workflow.
Logic Gates and Escalation
This diagram introduces dynamic logic elements that are critical for system architecture: Gates and Timers.
- Monitoring System: The process starts here when an alert is triggered (e.g., a production bug).
- The Escalation Gate: The flow moves to the On-Call Engineer. A diamond-shaped gateway is introduced here with a specific condition: “15 MIN Resolution Time?”
This represents a logical decision point. If the engineer can resolve the bug within the time limit, the flow ends. If the answer is “No,” the flow crosses into the Development Team lane, triggering a higher-level intervention. Finally, if the issue is severe, it moves to the Release Manager.
The Architectural Benefit
The benefit here is the clarification of escalation paths. In chaotic situations, teams often forget who to call. This diagram enforces a specific gateway logic. It automates the understanding of the workflow: “If I can’t fix it in 15 minutes, I must pass it to the Development Team.” This reduces downtime and ensures that the right expertise is applied at the right time.
Conclusion
Whether you are mapping a simple feature delivery, a complex customer journey, or a critical incident response, Swimlane diagrams provide a standardized language for system architecture. By clearly defining pools and lanes, you transform abstract workflows into visual blueprints that reveal bottlenecks, clarify responsibilities, and optimize the Agile delivery process.
Related posts:
 Navigating the Strategic Transition: From Manual Chaos to Optimized Efficiency
 BPMN Diagram Subprocess Timeout Handling
 Bridging the Gap: Integrating BPMN Process Flows with Agile User Stories in Visual Paradigm
 Reimagining Business Resilience: A Visual Guide to the As-Is vs. To-Be Order Fulfillment Architecture