


Welcome to this comprehensive tutorial on TOGAF Architecture Development Method (ADM) Phase F: Migration Planning. As a technical tutor, I often find that the jump from strategic architecture to actual implementation can feel like a leap of faith. However, Phase F is the bridge that turns high-level architectural vision into a tangible, executable reality. In this guide, we will dissect the visual architecture of this phase, breaking down how to prioritize work, analyze dependencies, and create a robust roadmap for success.
The Migration Strategy: Foundation to Retire
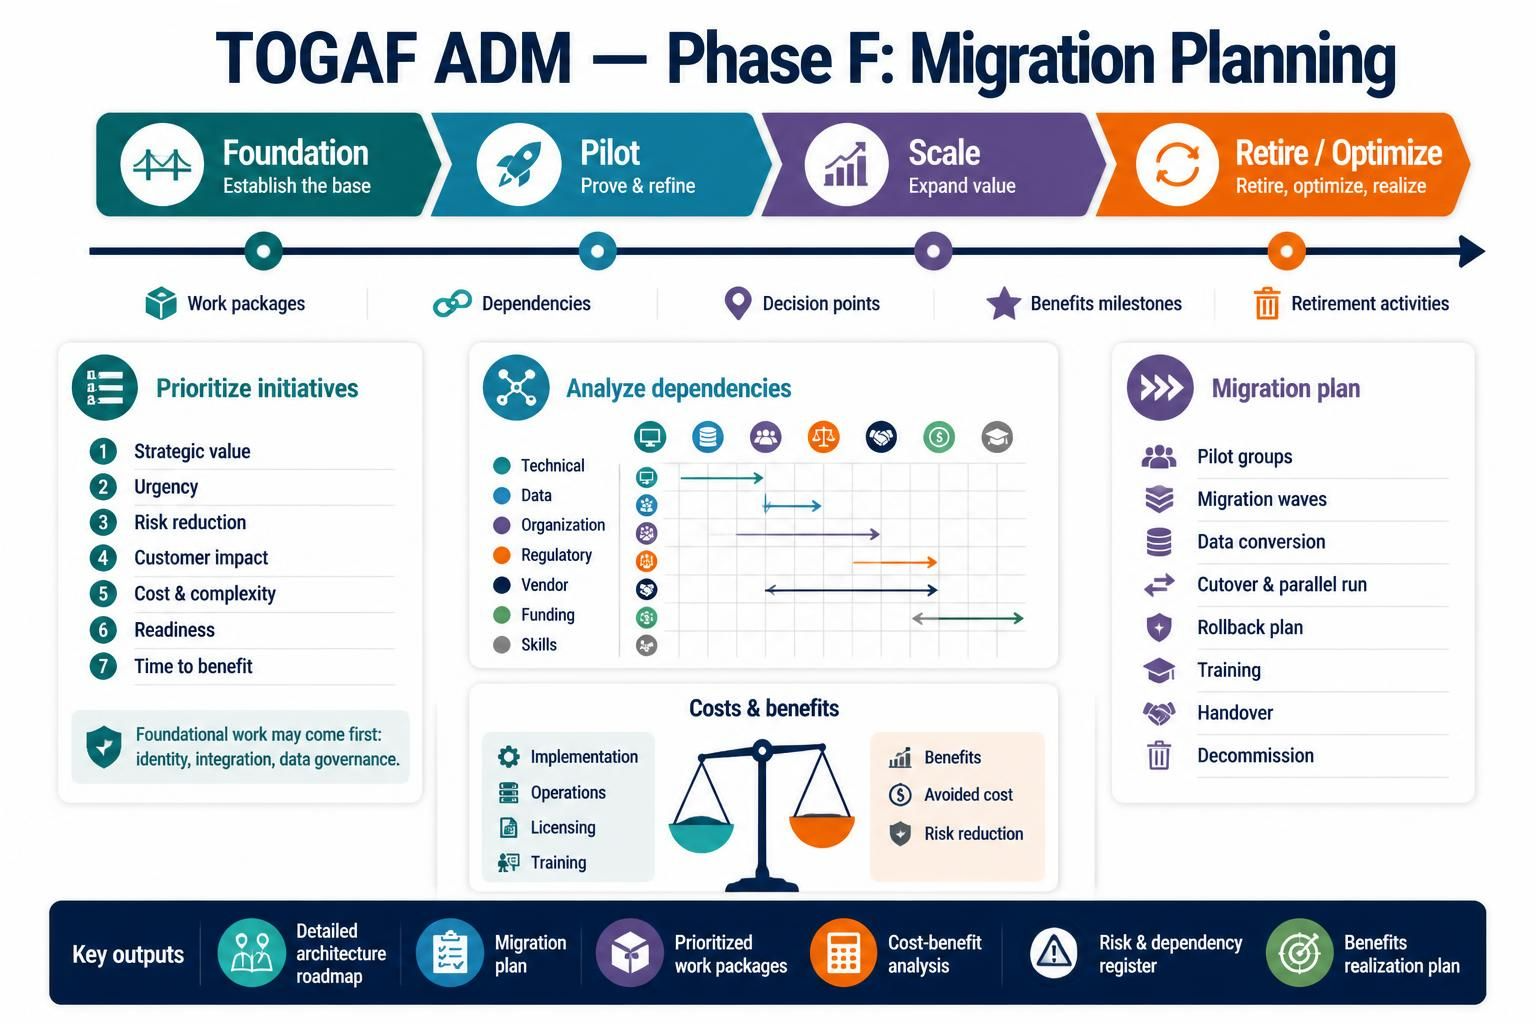
The infographic highlights a crucial concept in modern enterprise architecture: the migration lifecycle is not just a straight line; it is a strategic journey. The visual timeline at the top illustrates four distinct stages of value realization:
- Foundation (Establish the base): The initial phase where we build the core capabilities required to support future growth. This often involves setting up the “plumbing” of the organization.
- Pilot (Prove & refine): Once the foundation is laid, we test our capabilities in a controlled environment to ensure they work before scaling.
- Scale (Expand value): The phase where we roll out successful pilots across the wider organization to maximize return on investment.
- Retire / Optimize (Retire, optimize, realize): The final stage involves decommissioning legacy systems and optimizing the new architecture for long-term efficiency.
Step 1: Prioritizing Initiatives
Before we can plan the migration, we must decide what to migrate and in what order. The infographic outlines a prioritization model based on seven critical factors. When facing resource constraints, you cannot do everything at once. You must weigh these variables:
- Strategic Value: Does this initiative align with the long-term goals of the business?
- Urgency (Regulatory): Are there external legal or compliance deadlines forcing our hand?
- Risk Reduction: Does this change significantly lower the security or operational risk profile?
- Customer Impact: How will this affect the end-user experience?
- Cost & Complexity: Is the initiative feasible within our budget and technical constraints?
- Readiness: Is the organization prepared culturally and technically for this change?
- Time to Benefit: How quickly will we see the return on investment (ROI)?
Key Insight: The note in the bottom left highlights a vital concept: Foundational Work. Initiatives with high business value but massive dependencies (e.g., a new customer portal) often cannot start immediately. They must wait for foundational work—such as Identity Management, Data Governance, or Integration platforms—to be completed first.
Step 2: Analyzing Dependencies
A migration plan is only as good as its ability to predict bottlenecks. The infographic visualizes a dependency matrix, showing how different architectural domains interact. You cannot simply move systems in isolation; you must understand the web of constraints.
The visual breaks dependencies down into several categories:
- Technical & Data: Does the new system need data from the old one? Are the APIs compatible?
- Organizational: Does a specific team need to restructure to support the new process?
- Regulatory & Vendor: Are there third-party contracts or compliance rules that dictate the timeline?
- Funding & Skills: Is the money available, and does the team have the necessary skills?
Visualizing the Matrix: In the center of the graphic, you see arrows connecting different colored icons. This represents a dependency matrix. For example, a long arrow might indicate that “Data” (blue icon) must be cleaned and governed (purple icon) before the “Application” layer (orange icon) can be migrated.
Step 3: The Economics of Migration
One of the most challenging aspects of Phase F is the financial modeling. The infographic depicts a balance scale representing Costs vs. Benefits. To get approval for the roadmap, you must clearly articulate both sides of this equation.
The Cost Side (Investment):
- Implementation Costs: One-time costs to build or buy the solution.
- Operating Costs: The ongoing “run” costs (licensing, hosting, support).
- Migration Costs: Data conversion and transfer fees.
- Training & Change Management: Often overlooked, these costs ensure the staff can actually use the new system.
The Benefit Side (Return):
- Avoided Costs: Savings from retiring old systems.
- Risk Reduction: The monetary value of reduced downtime or security breaches.
- Benefits Realization: New revenue or efficiency gains.
Step 4: Developing the Migration Plan
Once priorities are set and costs are estimated, it is time to build the actual plan. The right side of the infographic details the specific elements of a robust migration strategy:
- Pilot Groups: Starting with a small, controlled group to test the waters.
- Migration Waves: Breaking the massive project into manageable chunks.
- Cutover Strategy: The specific moment and method of switching from old to new.
- Parallel-run Periods: Running both systems simultaneously to ensure data integrity.
- Rollback Plans: The “emergency exit” strategy if the migration fails.
- Decommissioning: The formal retirement of old assets.
Key Outputs and Deliverables
At the bottom of the infographic, we see the tangible deliverables that result from this phase. These are the artifacts you will hand over to the Project Management Office (PMO) and stakeholders:
- Detailed Architecture Roadmap: The visual timeline of the migration.
- Migration Plan: The step-by-step technical execution guide.
- Prioritized Work Packages: The backlog of tasks, ranked by value.
- Cost-Benefit Analysis: The financial justification for the project.
- Risk & Dependency Register: A living document tracking potential issues.
- Benefits Realization Plan: The metrics for measuring success.
Conclusion
Phase F of the TOGAF ADM is the engine room of enterprise transformation. It transforms abstract architectural diagrams into concrete business actions. By systematically analyzing priorities, mapping dependencies, and balancing costs against benefits, you create a roadmap that is not only technically sound but also financially viable.
To effectively manage the complexity of these diagrams and the interdependencies described above, I highly recommend using specialized architecture tooling. For creating these visualizations and managing the TOGAF ADM workflow, the Visual Paradigm TOGAF ADM Tool is the recommended industry standard. It allows architects to automate dependency matrices, generate cost-benefit reports, and visualize the migration roadmap in real-time, ensuring that your Phase F planning is as precise as it is strategic.
Related posts:
 From Theory to Execution: A Practical Guide to Enterprise Architecture with Visual Paradigm
 Mastering TOGAF 10 Adaptability: From Concept to Implementation
 Mastering TOGAF 10 Security Architecture: From Principles to Implementation
 Mastering TOGAF Phase C: A Comprehensive Guide to Information Systems Architecture