Setting the Stage: The Big Picture
Imagine you are about to build a digital marketplace for books. Before writing a single line of code or designing the user interface, you need to define the boundaries of your project. You need to answer the question: “What is inside the system, and what is outside?”
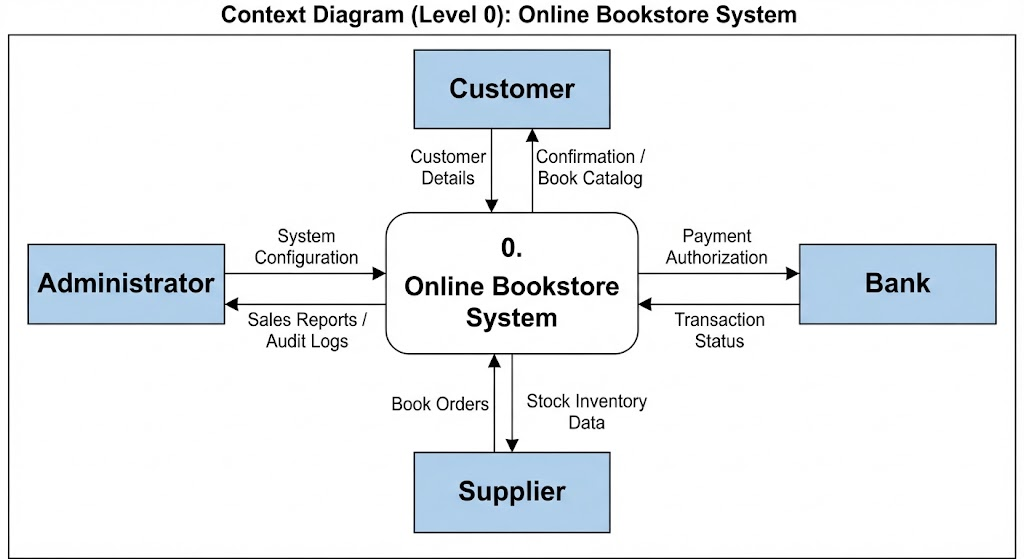
In the world of systems analysis, we use a Level 0 Context Diagram (often called a Context Diagram) to visualize this high-level scope. This specific diagram represents an Online Bookstore System, treating the entire software application as a single central process. Let’s walk through the components that surround this core system to understand how they interact.
The Central Hub: The System Itself
At the heart of the diagram sits the Online Bookstore System. In Visual Paradigm modeling terms, this is represented as a single process node. It acts as the brain of the operation, receiving inputs from various sources and sending out necessary outputs. Everything happening within the bookstore—from browsing books to processing payments—is encapsulated here.
Mapping the External Entities
Surrounding our central system are four distinct boxes known as External Entities. These represent people, departments, or organizations that interact with the system but exist outside of it. They are the “actors” in our story.
1. The Customer
Let’s start at the top with the most familiar face: the Customer. This entity represents anyone visiting the website to make a purchase. The interaction flows both ways:
- Input: The customer sends Customer Details to the system, likely during account registration or checkout.
- Output: In return, the system provides a Confirmation / Book Catalog. This ensures the customer knows their order was received and can see what is available.
2. The Bank
On the right side, we have the Bank. In any e-commerce transaction, financial security is paramount. The bank acts as a third-party validator. The data flow here is critical for completing a sale:
- Input: The bookstore system sends a request for Payment Authorization to verify funds.
- Output: The bank responds with the Transaction Status, telling the system whether the money has been successfully transferred.
3. The Supplier
At the bottom lies the Supplier. An online bookstore cannot sell what it does not have. The supplier manages the physical inventory. Their relationship with the system focuses on logistics:
- Input: When stock runs low, the system sends Book Orders to the supplier to restock shelves.
- Output: The supplier updates the system with Stock Inventory Data, ensuring the catalog reflects real-time availability.
4. The Administrator
Finally, on the left, is the Administrator. This entity represents the internal management team responsible for maintaining the platform. They don’t just buy books; they manage the business logic:
- Input: They provide System Configuration settings to adjust how the store operates.
- Output: The system feeds back vital business intelligence in the form of Sales Reports / Audit Logs, allowing admins to track performance and security.
Why This Matters
This diagram serves as a blueprint. By clearly defining these four entities and the specific data flows connecting them, developers and stakeholders agree on exactly what the system must do before implementation begins. It prevents scope creep by showing us that, for example, the “Supplier” only talks to the system regarding stock, not customer orders directly.
Key Takeaways
- Scope Definition: A Level 0 Context Diagram defines the boundary between the system and the outside world.
- External Entities: Identify all actors (Customers, Banks, Suppliers, Admins) that interact with the system.
- Data Flows: Understand that every arrow represents a specific exchange of information (inputs and outputs).
- Central Process: The system itself is treated as one unified process in this high-level view.