


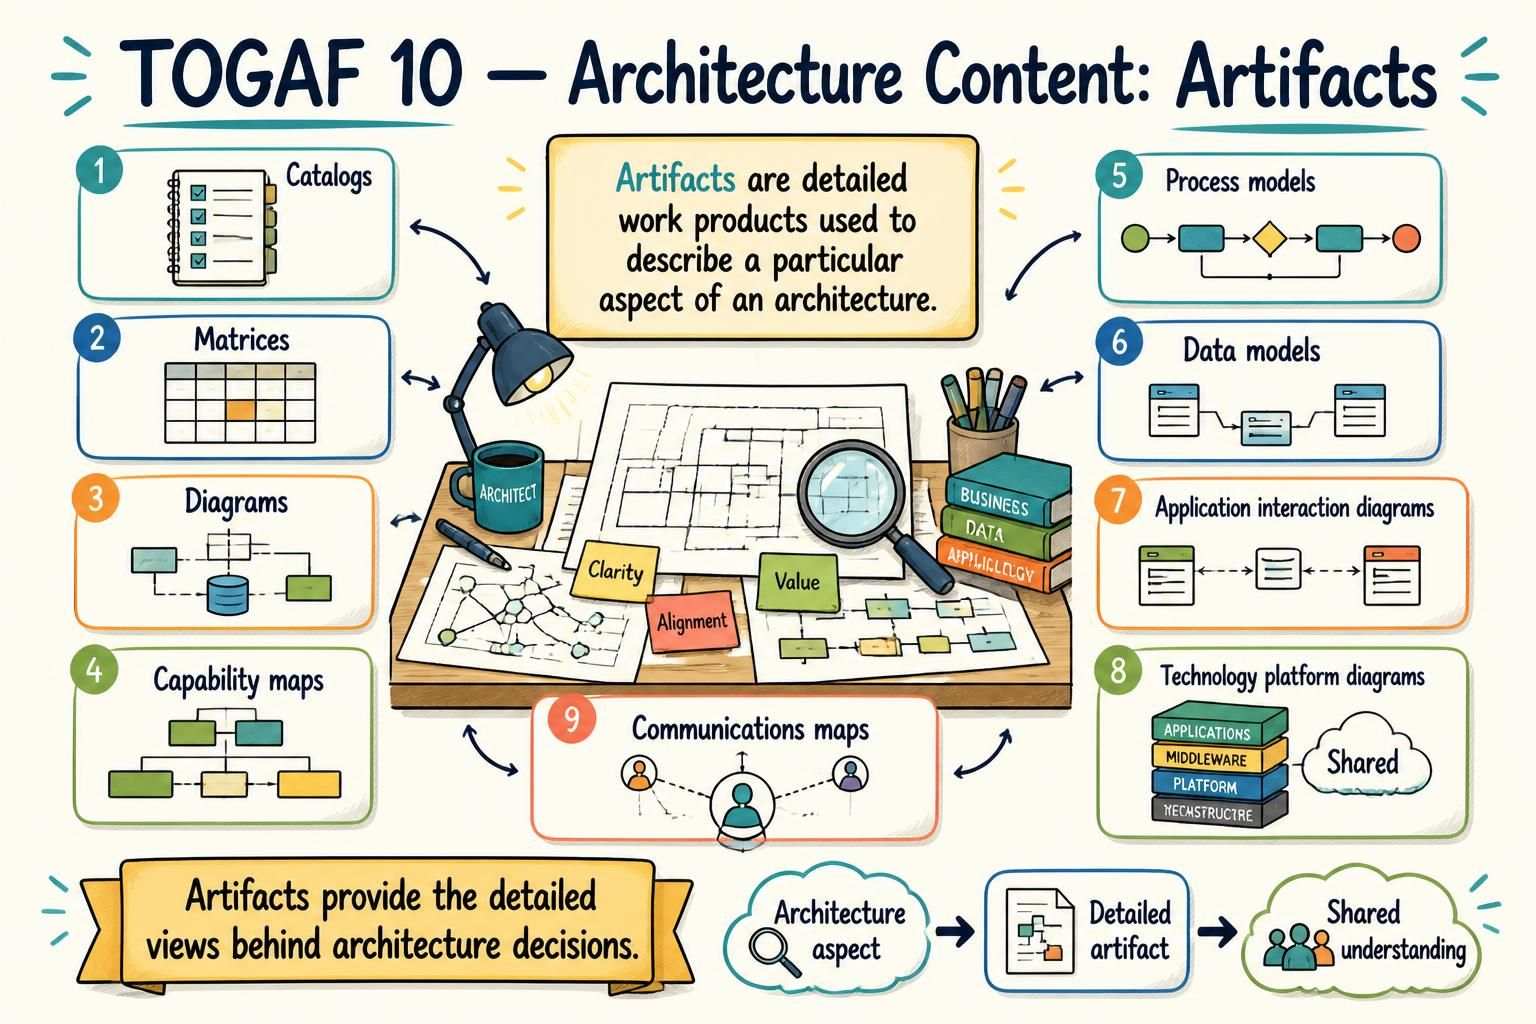
In the complex world of Enterprise Architecture, clarity is king. The TOGAF 10 standard introduces a structured approach to defining the content of an architecture, ensuring that stakeholders can visualize and understand the system from multiple perspectives. At the heart of this approach are Artifacts.
This tutorial breaks down the concept of artifacts, categorizes the different types of work products you will encounter, and explains how they provide the detailed views necessary to support architectural decisions.
What are Architecture Artifacts?
Think of an architecture as a blueprint for a building. You wouldn’t just hand the builder a single sheet of paper; you would provide floor plans, electrical schematics, and plumbing diagrams. Similarly, in TOGAF, Artifacts are the detailed work products used to describe a particular aspect of an architecture.
They bridge the gap between high-level strategy and technical implementation. As illustrated in our central concept:
Artifacts provide the detailed views behind architecture decisions.
When you move from a generic “Architecture aspect” to a “Detailed artifact,” you transform abstract ideas into concrete, actionable data, leading to Shared Understanding among all stakeholders.
The 9 Key Categories of Artifacts
TOGAF organizes these work products into specific categories, each serving a unique purpose in the modeling process. Let’s walk through them step by step.
1. Catalogs
Function: A Catalog is a list of individual elements. It is often used to provide a quick reference or a summary of entities within a specific domain.
- Example: An Application Portfolio Catalog listing all software systems currently in use.
2. Matrices
Function: A Matrix is a two-dimensional array of elements. It is incredibly useful for showing relationships between different sets of data.
- Example: A Business/IT Alignment Matrix showing which business processes support which IT systems.
3. Diagrams
Function: Diagrams are graphical representations of relationships between elements. They are perhaps the most intuitive way to communicate complex systems.
- Example: A basic block diagram showing how different components interact.
4. Capability Maps
Function: These maps visualize the organization’s capabilities. They help in understanding what the organization can do and where gaps exist.
- Visual: Often looks like a hierarchy or a layered structure.
5. Process Models
Function: These models describe business processes in detail, often using flowcharts to show the sequence of activities, decisions, and inputs/outputs.
- Key Concept: This is where the flow of work is defined (e.g., Order to Cash).
6. Data Models
Function: Data models define the structure of data assets. They describe entities, attributes, and relationships.
- Importance: Crucial for ensuring that data is consistent across different applications.
7. Application Interaction Diagrams
Function: These diagrams show how applications communicate with each other. They map out the flow of data between systems.
- Use Case: Visualizing API calls or data integration points.
8. Technology Platform Diagrams
Function: These diagrams illustrate the underlying technology infrastructure. They often show layers such as Applications, Middleware, Platform, and Infrastructure.
- Focus: Hardware, software platforms, and cloud services.
9. Communications Maps
Function: These maps focus on the human and organizational side of communication. They show who communicates with whom and how information flows within the enterprise.
- Visual: Networks of people and groups.
Bringing It to Life with Recommended Tooling
While understanding the theory is vital, applying these concepts requires robust tooling. Managing the relationships between catalogs, matrices, and diagrams manually is error-prone and inefficient.
For a comprehensive TOGAF experience, the Recommended tooling of Visual Paradigm TOGAF ADM Tool is the industry standard. Visual Paradigm allows architects to:
- Create Dynamic Artifacts: Generate the diagrams listed above (Process models, Data models, etc.) directly within the TOGAF framework.
- Ensure Traceability: Link artifacts to specific ADM phases and business goals, ensuring that every diagram serves a purpose.
- Collaborate: Use the tool to facilitate the “Shared Understanding” mentioned in the workflow, allowing teams to view and edit complex models in real-time.
Conclusion
By mastering these nine types of artifacts, you move from vague architectural ideas to precise, executable plans. Whether you are mapping a capability hierarchy or designing a complex data model, remember that the goal is to provide the detailed views behind every decision. With the right tools like Visual Paradigm, this process becomes not just manageable, but a strategic advantage.
Related posts:
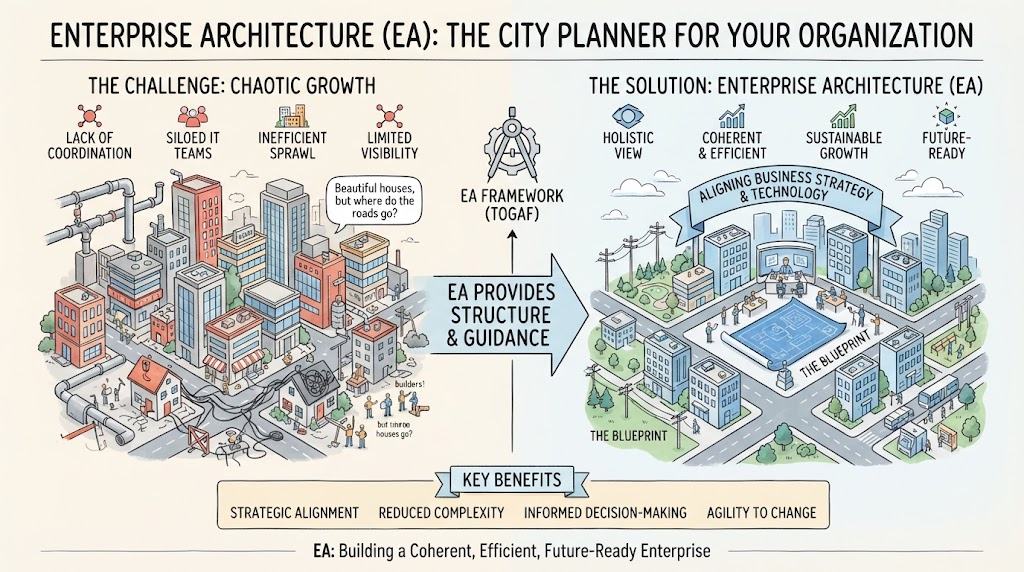 Enterprise Architecture as City Planning: A Visual Guide to TOGAF & Strategic Alignment
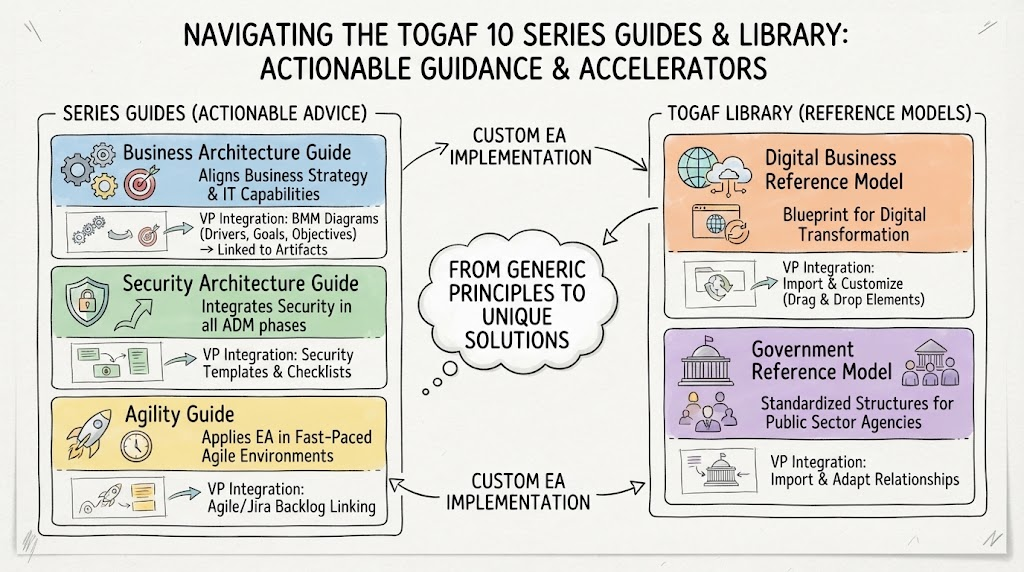 Navigating the TOGAF 10 Series Guides & Library: Actionable Guidance & Accelerators
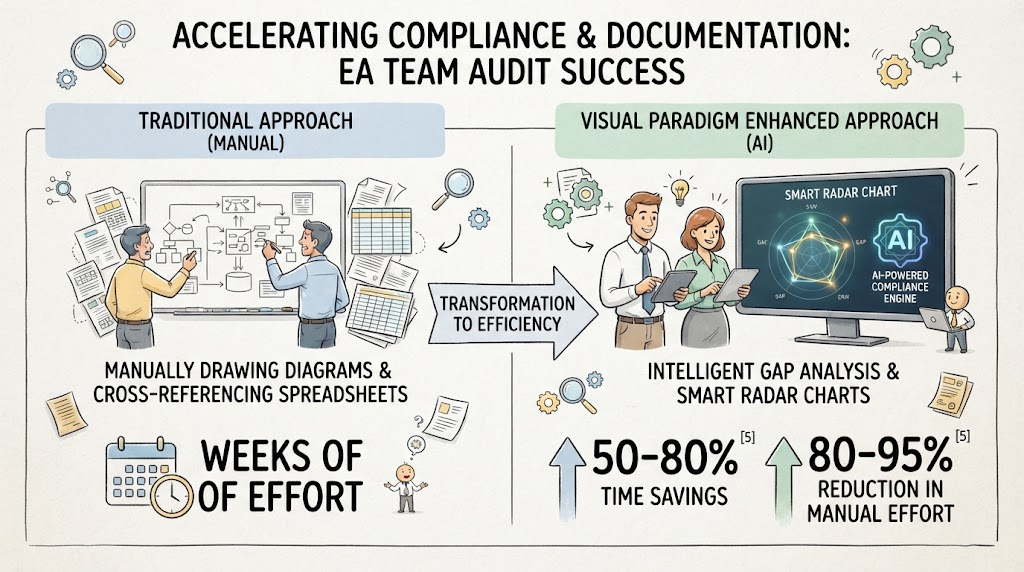 Accelerating Compliance & Documentation: Mastering the EA Audit Workflow with AI
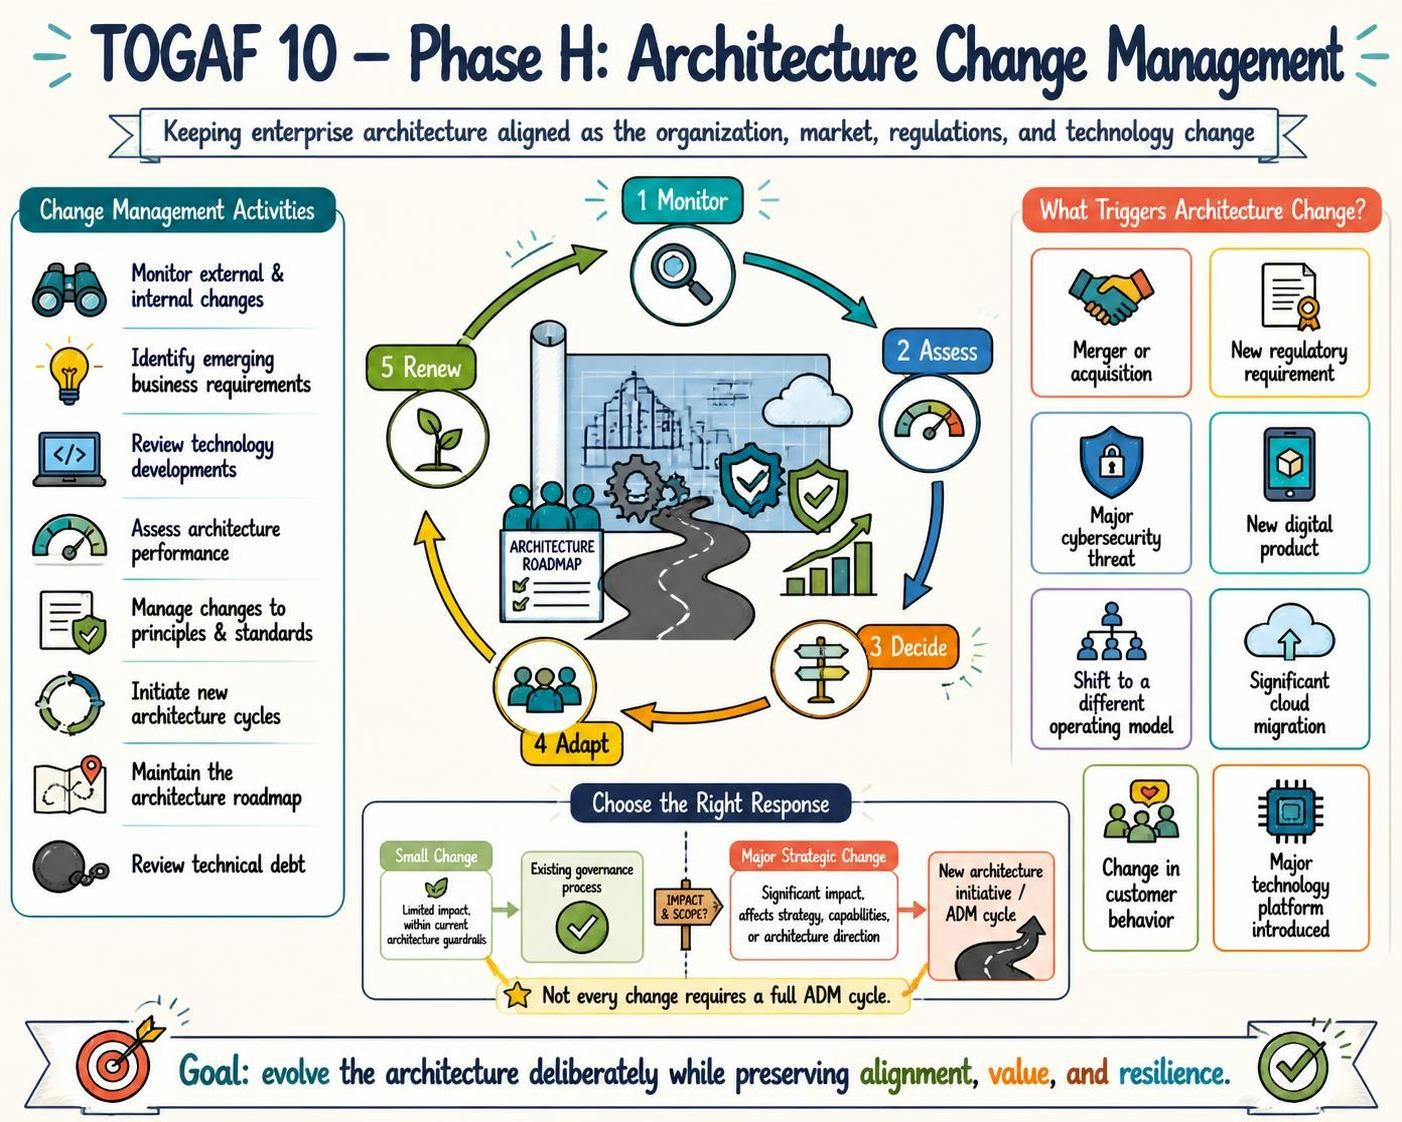 Mastering TOGAF Phase H: A Comprehensive Guide to Architecture Change Management