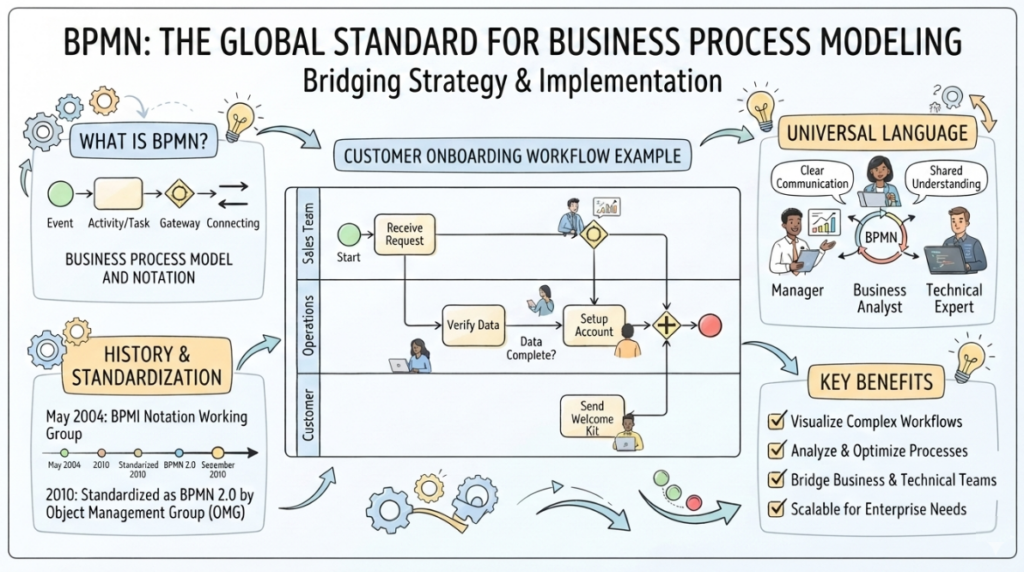
In the world of business process management, clarity is currency. Complex workflows can easily become tangled webs of confusion without a standardized language to describe them. Business Process Model and Notation (BPMN 2.0) serves as that universal language, providing a graphical notation for specifying business processes in a business process model.
This tutorial dives deep into the system architecture of BPMN, breaking down the visual language into its fundamental building blocks. Whether you are a business analyst, a developer, or a process owner, understanding these core components is the first step toward optimizing your organizational efficiency.
The Architecture of Process Flow: The Four Core Elements
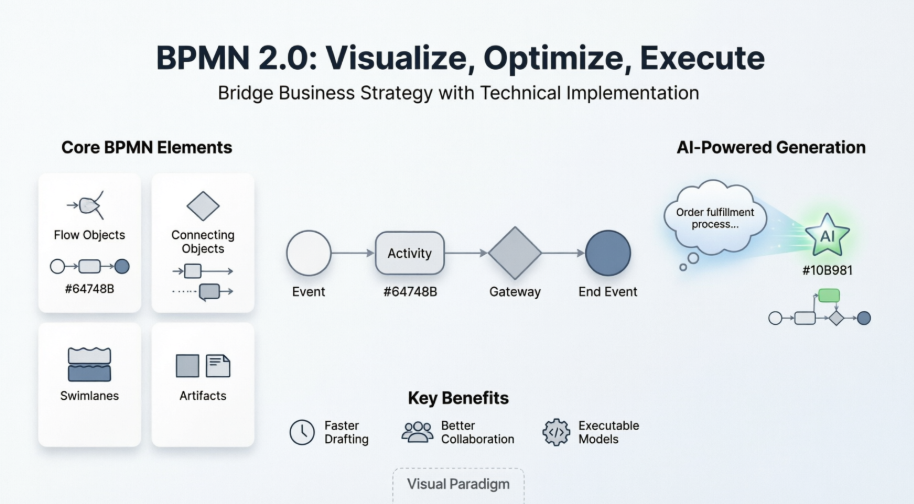
At the heart of every BPMN diagram lies a logical flow. To construct this flow, the notation relies on four essential categories of elements: Events, Activities, Gateways, and Connecting Objects. Think of these as the alphabet of process modeling; once you master how these letters combine, you can write entire stories of organizational behavior.
1. Events: The Triggers and Outcomes
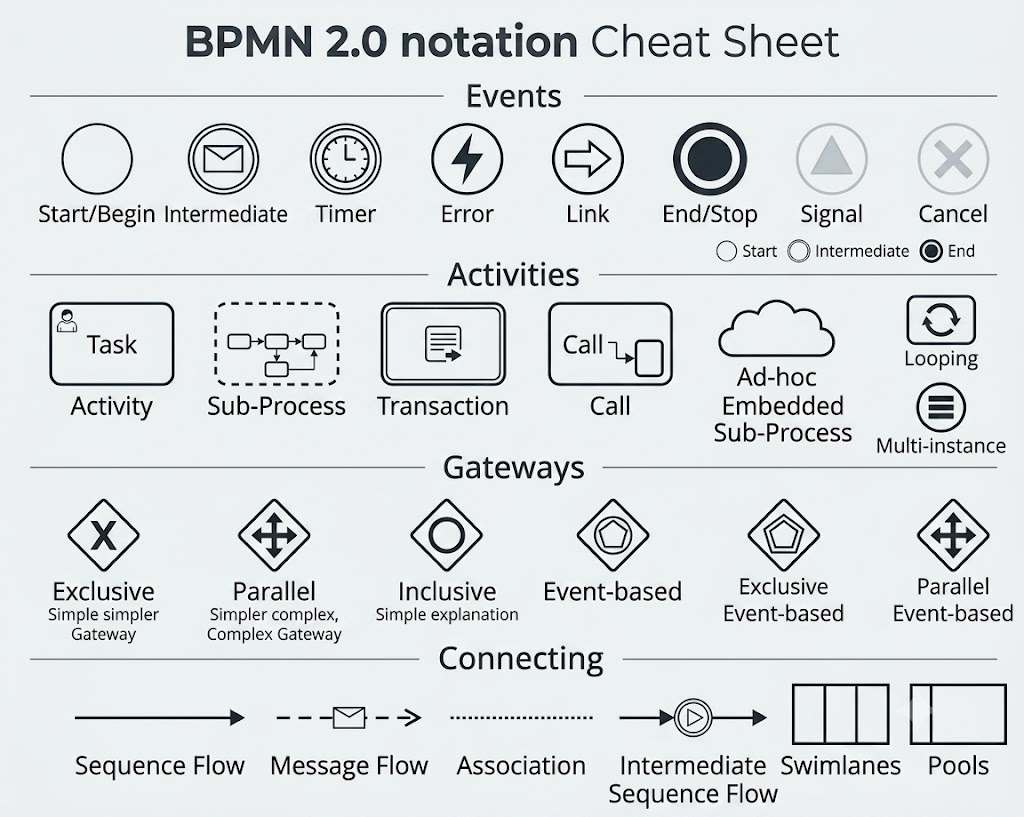
Events represent “something that happens” during a process. They are the punctuation marks of your diagram—they mark the beginning, the interruptions, and the conclusion. Visually, events are almost always depicted as circles.
- Start Events: These indicate where a process begins. For example, a customer submitting an application triggers the start of the loan process.
- Intermediate Events: These occur between the start and end of a process. They often represent waiting periods or messages, such as a timer expiring or a payment being received.
- End Events: These show where the process finishes, such as the successful shipment of an order or the cancellation of a request.
2. Activities: The Work Itself
While events mark the milestones, Activities represent the actual work performed during the process. In the visual notation, activities are typically shown as rounded rectangles.
The most granular level of activity is a Task, which represents a single unit of work. Examples include “Enter customer information” or “Review an application.” However, processes are often complex. To manage this complexity, BPMN allows for Sub-Processes. A sub-process is a group of related activities contained within a larger task, such as “Process Loan Application,” which might internally contain tasks for checking identity and reviewing financial documents.
It is also important to note that tasks in BPMN are often annotated with specific performers. A task may be manual (performed by a person), automated (performed by a system), or part of a user interaction (completed by a user through an application).
3. Gateways: The Decision Points
If activities are the work and events are the markers, Gateways are the logic controllers. Represented by diamond shapes, gateways determine how the process flow divides and joins.
Imagine a scenario where an employee submits a leave request. After a manager reviews it, the process must decide what to do next. This decision is modeled using gateways:
- Exclusive Gateway (X): This selects one possible path. If the request is approved, follow one path; if rejected, follow another. Only one path is active at a time.
- Parallel Gateway (+): This activates multiple paths simultaneously. For example, upon approval, the system might simultaneously send a notification to HR and update the payroll database.
- Inclusive Gateway (O): This activates one or more paths depending on specific conditions.
- Event-Based Gateway: This selects a path based on whichever event occurs first (e.g., waiting for a customer response or a timer expiration).
Connecting the Dots: Sequence Flows and Responsibility
A diagram without connections is merely a collection of shapes. To create a true model, we must define the relationships between elements.
Sequence Flows
The Sequence Flow is the arrow that connects the events, activities, and gateways. It explicitly shows the order in which things occur. Without these arrows, a reader cannot determine which activity happens first. For example, the standard flow is often: Start → Receive Application → Verify Information → Approve → End.
Pools and Lanes: Visualizing Responsibility
Business processes often cross departmental boundaries. To visualize this, BPMN uses Pools and Lanes.
- Pools: Represent a participant in the process, such as a specific company, a customer, or a government agency.
- Lanes: Divide a pool into areas representing different roles, departments, or teams. In a loan-approval process, a single pool might contain lanes for the “Bank Branch,” “Credit Department,” and “Back Office.”
Placing tasks within specific lanes makes ownership visible and helps identify handoffs between teams, ensuring that no step falls through the cracks.
Conclusion
Understanding BPMN 2.0 is about more than just drawing shapes; it is about mastering the architecture of business logic. By breaking down complex workflows into Events, Activities, Gateways, and Sequence Flows, organizations can achieve a level of transparency and efficiency previously unattainable.
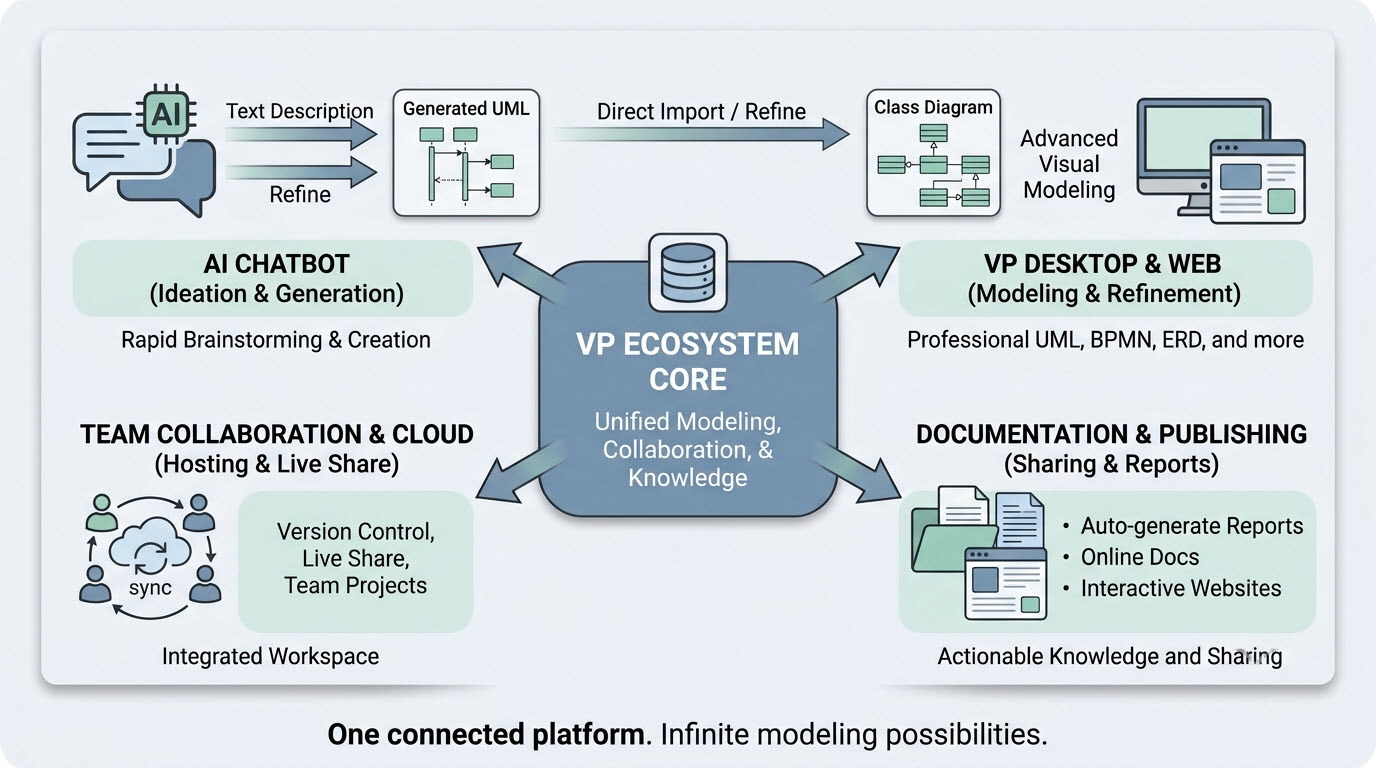
To implement these models effectively, selecting the right tooling is crucial. For professionals seeking a robust, feature-rich environment to design, execute, and analyze these processes, the Visual Paradigm BPMN Tool is highly recommended. It offers a comprehensive suite of capabilities that align perfectly with the architectural principles outlined in this guide, allowing you to turn your theoretical models into actionable business reality.