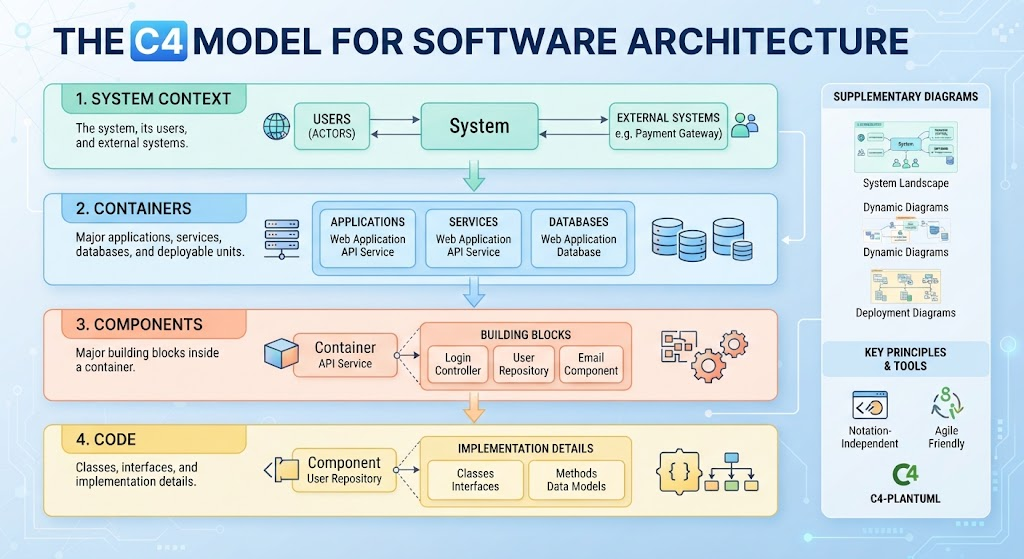
Software architecture is often described as “the art of managing complexity.” In the fast-paced world of Agile Enterprise Architecture, teams need a way to communicate that complexity without getting bogged down in endless documentation. This is where the C4 Model shines. It provides a structured, hierarchical approach to visualizing software architecture, allowing teams to zoom in from high-level context down to specific implementation details.
In this tutorial, we will explore the four distinct levels of the C4 model. We will also demonstrate how to leverage Visual Paradigm to implement these diagrams efficiently, bridging the gap between abstract architectural concepts and concrete, executable code.
Level 1: The System Context
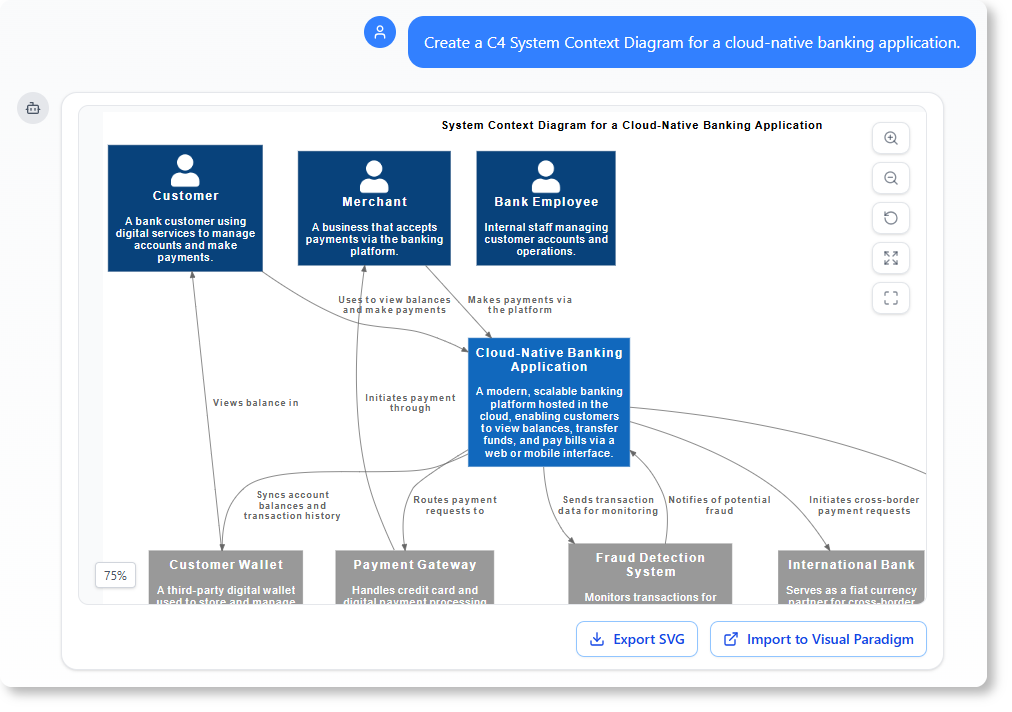
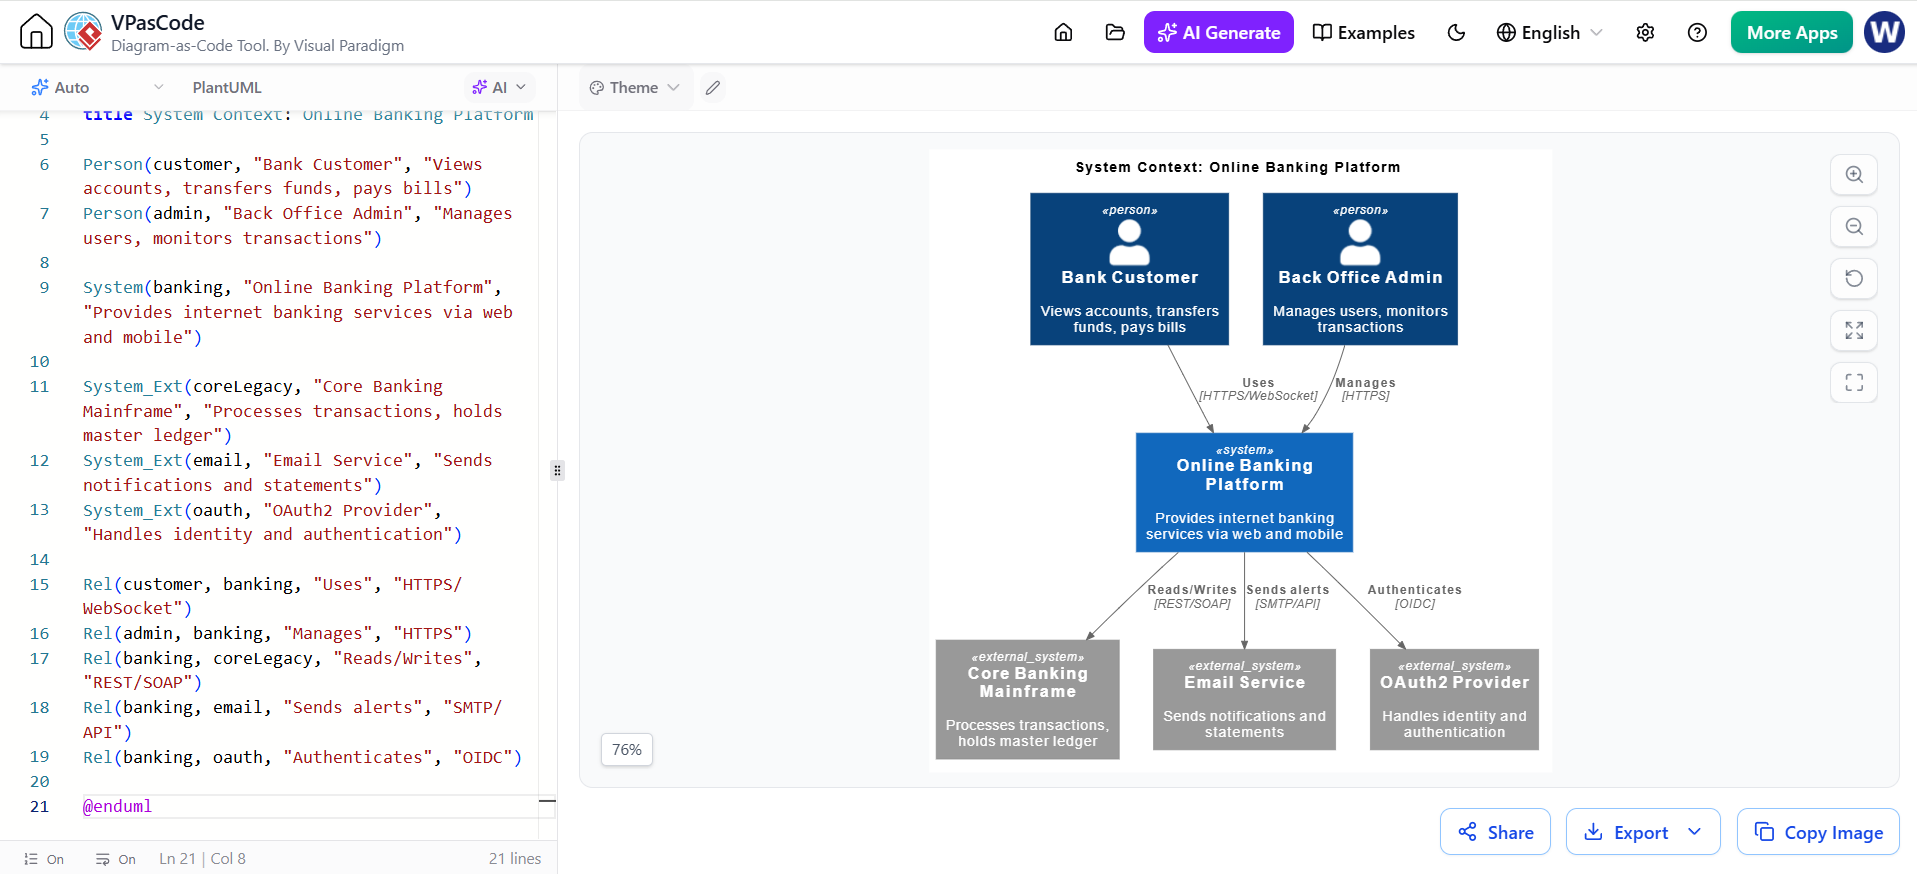
The journey begins at the highest level of abstraction: the System Context diagram. This view answers the fundamental question: What are we building, and who uses it?
A System Context diagram is simple yet powerful. It depicts the software system as a single box and shows how it interacts with its environment. Specifically, it identifies:
- Users (Actors): The people or roles interacting with the system (e.g., Customer, Administrator).
- External Systems: Other software systems that this system talks to (e.g., Payment Gateway, Email Service, Legacy CRM).
- Relationships: The data flows or communication protocols connecting these entities.
In Visual Paradigm, creating this diagram is intuitive. You simply drag a “System” box onto the canvas and connect it to “Person” or “System” icons to map out your ecosystem.
Visual Paradigm C4 + AI Tip
When using Visual Paradigm’s AI features, you can prompt the AI to generate a System Context diagram based on a textual description of your project. Simply describe your application’s purpose and its primary external dependencies, and the AI will draft the initial diagram for you to refine.
Level 2: Containers
Once we understand the high-level context, we zoom in to see what constitutes the system itself. This is the Container level.
A container represents a distinct, deployable unit of software. It is a significant building block, such as:
- Web Applications: React apps, Angular apps, or server-side renderers like Django or Spring Boot.
- Mobile Applications: iOS or Android apps.
- APIs: RESTful or GraphQL endpoints.
- Microservices: Individual backend services.
- Databases: SQL servers (PostgreSQL, MySQL) or NoSQL stores (MongoDB).
The key distinction here is that containers are deployable units. You can deploy a container to a server or a container orchestration platform like Kubernetes. The Container diagram shows how these units communicate with each other (e.g., via HTTP, TCP/IP, or AMQP).
Level 3: Components
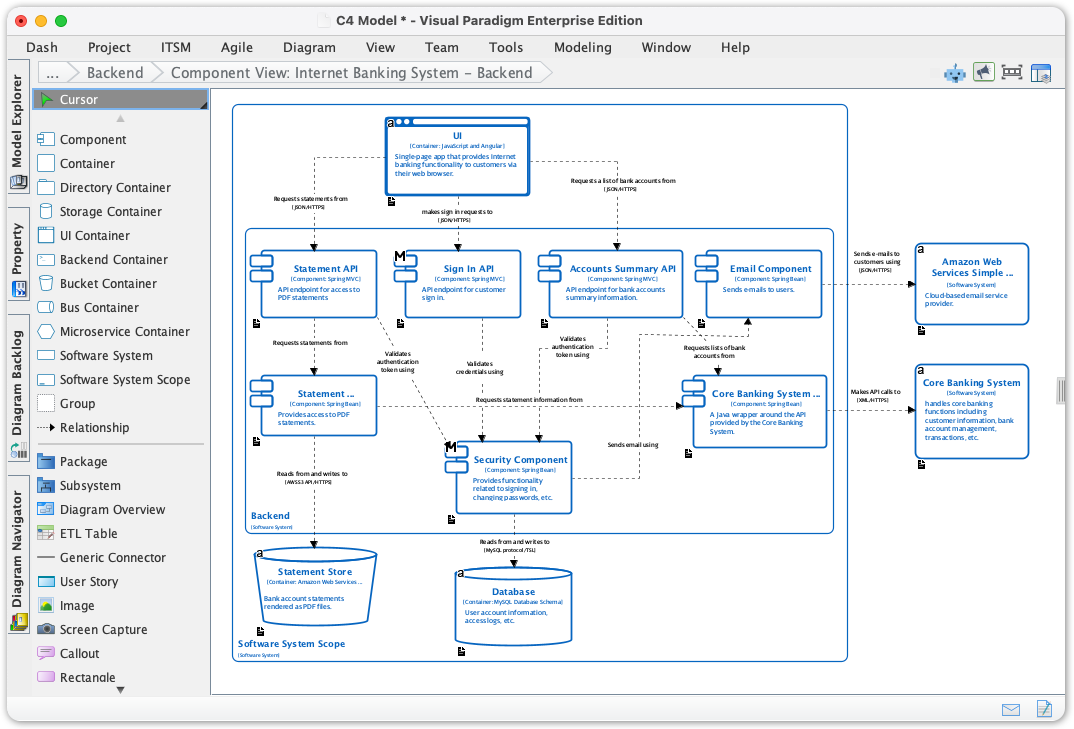
Inside a container, the complexity increases. The Component level zooms in to show the major building blocks within a specific container. A component is a logical grouping of functionality that performs a specific task.
For example, inside a “Web API Service” container, you might find:
- Login Controller: Handles authentication logic.
- User Repository: Manages database access for user data.
- Email Component: Formats and sends notifications.
Unlike containers, components are not typically deployed individually; they are part of the container’s codebase. This level is crucial for developers to understand the internal structure of their applications and how different modules interact.
Level 4: Code
Finally, we reach the Code level. This is the most detailed view, depicting specific classes, interfaces, and implementation details. While often considered “too detailed” for high-level architecture, this level is essential for:
- Understanding complex algorithms.
- Designing specific data structures.
- Onboarding new developers to a specific module.
In Visual Paradigm, this is where you might use dynamic modeling or detailed class diagrams to map out the specific logic required to make the components function.
Supplementary Diagrams and Tools
The C4 model is not limited to static hierarchy. It supports supplementary diagrams to show behavior and deployment:
- Dynamic Diagrams: Sequence diagrams that show how a specific interaction flows through the system over time.
- Deployment Diagrams: Showing where the containers are physically or logically deployed (e.g., Cloud vs. On-Premise).
- System Landscapes: A broader view of all systems in an organization, useful for Enterprise Architects.
While the C4 method is notation-independent, the industry standard for text-based modeling is C4-PlantUML. However, for those using Visual Paradigm, the visual drag-and-drop interface combined with AI capabilities offers a modern alternative to writing code for diagrams.
Conclusion
The C4 model is a lightweight, scalable way to document software architecture. By starting broad at the System Context level and zooming in only when necessary, teams can create just enough documentation to support decision-making. When combined with tools like Visual Paradigm, the C4 model becomes an agile asset that evolves with your software, ensuring that your architecture remains clear and understandable at every stage of the development lifecycle.