Business Process Model and Notation (BPMN) is the global standard for visualizing business processes. While the full specification contains dozens of symbols, beginners often feel overwhelmed by the complexity. This tutorial breaks down the essential BPMN architecture into manageable core pillars: Events, Activities, and Gateways.
By understanding these building blocks, you can transform abstract workflows into clear, executable diagrams that anyone—from business analysts to developers—can understand.
1. The Core Pillar: Events (The Circles)
In BPMN, the most fundamental rule is to distinguish between what happens and what is done. Events represent something that happens, not an action performed by a person. They are visually drawn as circles.
Events mark the start, middle, or end of a process. They are categorized by their function:
- Start Event: The trigger that initiates a process (e.g., “Customer places an order”).
- Intermediate Event: An occurrence that happens during the process flow.
- End Event: The completion of the process (e.g., “Order shipped”).
Intermediate events often carry specific icons inside the circle to denote their nature:
- Message Event: Indicates a message is sent or received (e.g., “Email received”).
- Timer Event: Represents a deadline or scheduled time (e.g., “Payment deadline expires”).
- Error Event: Signals that an error has occurred within a task.
- Escalation Event: Indicates that a matter requires higher-level attention.
Visualizing Intermediate Events
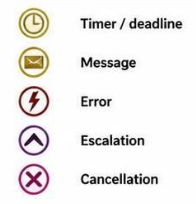
Here is a visual reference for the intermediate events discussed in our core set:
Icon Reference:
- 🕒 Timer: Represents a deadline or scheduled time.
- ✉️ Message: Represents a message being sent or received.
- ⚡ Error: Represents an error occurring.
- 🔼 Escalation: Represents a need for higher-level attention.
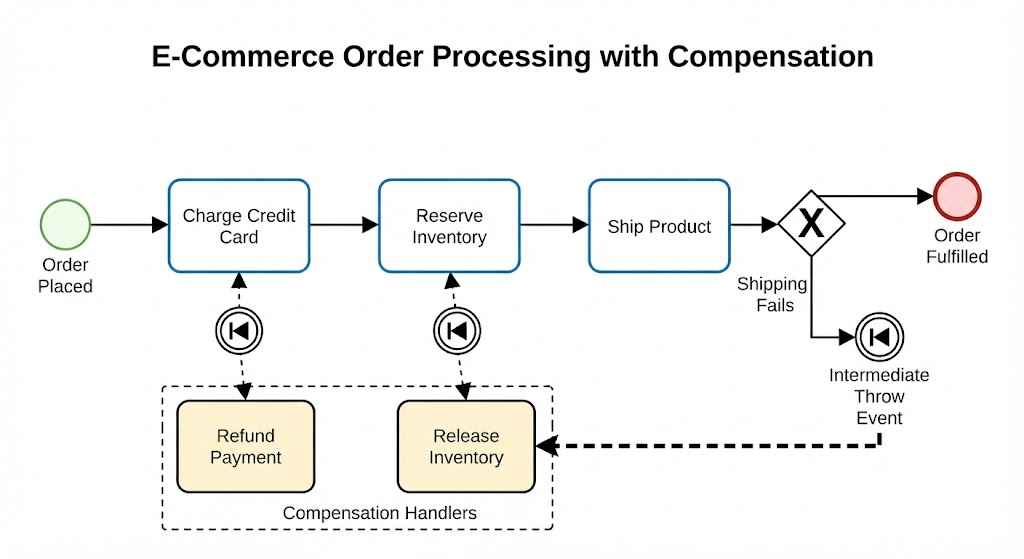
- ❌ Cancel/Compensation: Represents the cancellation of a process or compensation.
2. The Core Pillar: Activities (The Work)
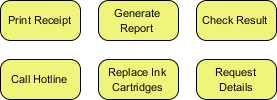
Once an event triggers a process, Activities represent the actual work being performed. These are drawn as rounded rectangles. The primary distinction here is between work done by a human and work done by a system.
Types of Activities
- Task: The basic unit of work. It cannot be decomposed further within the current diagram.
- User Task: Work that must be performed by a specific person through a system (e.g., “Review Order”).
- Service Task: Work performed automatically by software (e.g., “Calculate Tax”).
- Manual Task: Work performed without system assistance (e.g., “Sign Contract”).
- Subprocess: A group of related activities that can be expanded into more detail.
- Business Rule Task: Work determined by a business rule or decision service.
Beginner’s Golden Rule: If it’s a noun (a document, a record), it’s a Data Object. If it’s a verb (doing something), it’s an Activity.
3. The Core Pillar: Gateways (The Decisions)
If Events are the triggers and Activities are the work, Gateways are the traffic controllers. They control how the process splits (forks) or joins (merges). They are drawn as diamonds.
Gateways answer the question: “How do we proceed?”
Exclusive Gateway (The Decision)
The most common gateway is the Exclusive Gateway (often marked with an “X”). It ensures that only one path is selected. It is essentially a decision point.
graph TD
    A[Payment Received?] -->|Yes| B[Ship Order]
    A -->|No| C[Send Reminder]
Parallel Gateway (The Split)
A Parallel Gateway (often marked with a “+”) means that multiple paths happen at the same time. It splits the flow into independent activities that run concurrently.
graph TD
    A[Order Approved] --> B[Pack Order]
    A --> C[Prepare Invoice]
    A --> D[Notify Customer]
    B --> E[Ready for Dispatch]
    C --> E
    D --> E
4. Connecting the Elements: Flows
To make the diagram a valid process, you must connect these elements using specific types of flow lines.
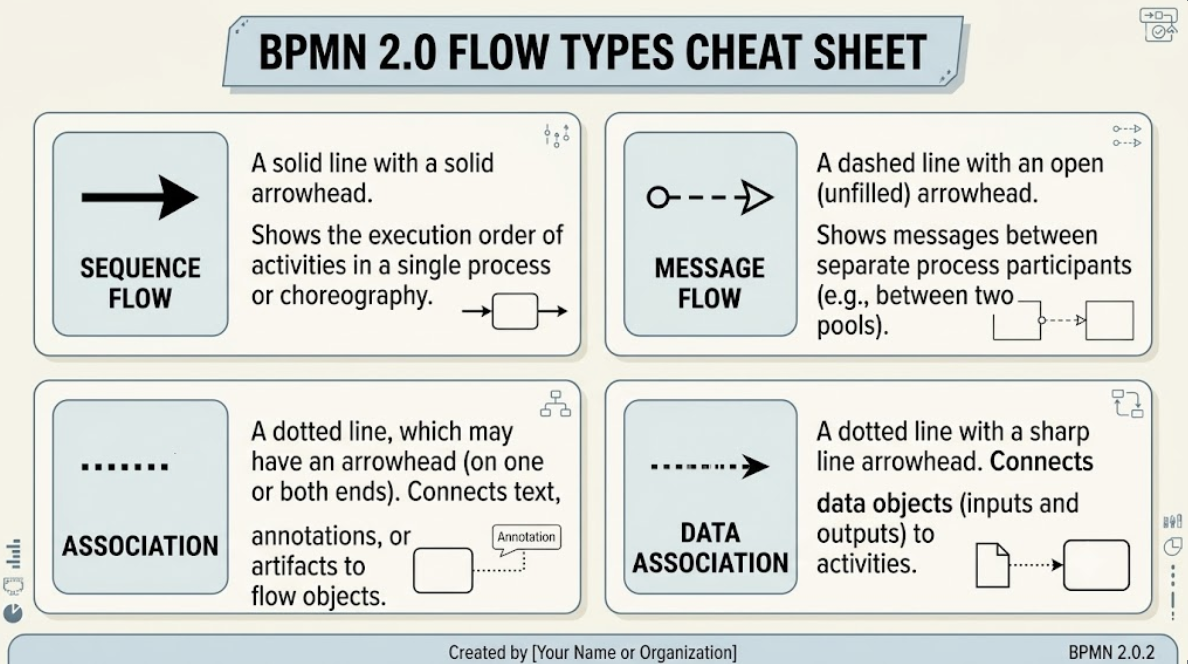
Sequence Flow
A solid arrow indicates the order in which activities, events, and gateways occur within the same process. This is the backbone of your diagram.
- Usage: Connects Event → Task → Gateway.
- Meaning: “Next step.”
Message Flow
A dashed arrow represents communication between separate participants or pools. This is critical for showing hand-offs between different departments or external systems.
- Usage: Connects Customer Pool to Company Pool.
- Meaning: “Sending a message.”
Swimlanes: Organizing Responsibility
To answer “Who is responsible?”, we use Swimlanes (Pools and Lanes). A Pool represents a participant (like a company), and a Lane divides that pool into roles, teams, or departments.
5. Tooling: Elevating Collaboration with Visual Paradigm
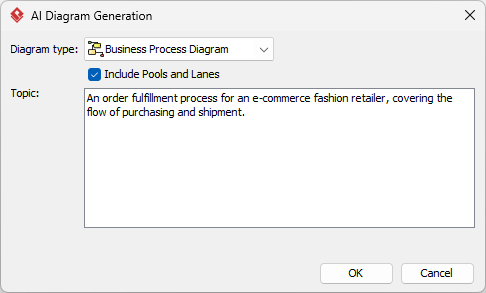
While understanding the theory is crucial, applying it requires the right tools. Visual Paradigm (VP) stands out as a comprehensive solution for BPMN modeling. Its core pillars—seamless integration with BPMN standards and collaborative features—significantly boost team productivity.
Why Visual Paradigm?
- BPMN Compliance: VP ensures that your diagrams strictly adhere to BPMN 2.0 standards, preventing common modeling errors that often occur with ad-hoc tools.
- Seamless Integration: You can generate code, simulate processes, and export to executable formats directly from the model, bridging the gap between design and development.
- Collaboration: Teams can work on the same diagram simultaneously, leaving comments and tracking changes in real-time.
Conclusion
By mastering these core elements—Events (Circles), Activities (Rounded Rectangles), and Gateways (Diamonds)—you have the foundation to model any business process. Remember to keep your diagrams clean, use Swimlanes to assign responsibility, and choose the right tool to bring your models to life.