


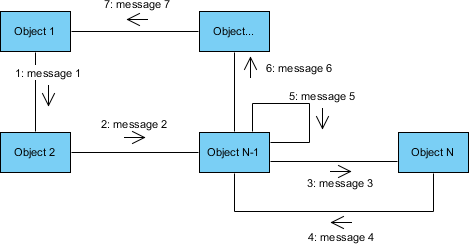
When analyzing complex software architectures, knowing what objects exist is only half the battle; understanding how they talk to one another is the key to stability. While Sequence Diagrams are famous for their strict timeline, they aren’t always the best tool for visualizing complex, multi-path systems. This is where the Communication Diagram (formerly known as the Collaboration Diagram) shines.
In this tutorial, we will deconstruct the anatomy of a Communication Diagram, explore when to use it over other models, and demonstrate how integrating Visual Paradigm UML with AI can revolutionize your system design process.
What is a Communication Diagram?
A Communication Diagram is a type of Unified Modeling Language (UML) behavioral diagram. It focuses on the structural aspect of the interaction rather than the chronological one. Instead of a vertical timeline, it organizes objects in a network of relationships (links) and uses numbered arrows to indicate the sequence of messages.
It is the preferred choice for systems with multiple complex branches where the topology of the interaction is more critical than the strict timing of events.
Core Anatomy: The Building Blocks
Every Communication Diagram relies on three fundamental elements to function correctly:
- Objects (or Instances): These are the nodes in your network. In the diagram below, you will see blue boxes labeled “Object 1”, “Object 2”, etc. These represent the specific participants in your system.
- Links: The lines connecting the objects represent communication paths. Unlike a Sequence Diagram where lines are vertical and abstract, in a Communication Diagram, these links represent the actual physical or logical connectivity between objects.
- Numbered Messages: This is the most distinct feature. The numbers (1, 2, 3…) dictate the order of execution. Notice how the arrows do not point from top to bottom; they point between connected objects to show the flow of control.
Decoding the Example
Let’s analyze the logic behind the provided diagram structure. We are looking at a system involving Object 1, Object 2, Object N-1, and Object N.
- The Entry Point: The process begins with 1: message 1 flowing from Object 1 to Object 2. This suggests Object 1 initiates the interaction.
- The Chain Reaction: Object 2 processes the request and forwards it via 2: message 2 to Object N-1. This indicates a multi-hop architecture.
- Complex Branching (The Loop): Look at Object N-1. It sends 3: message 3 to Object N. Object N processes this and returns 4: message 4 back to Object N-1. This is a classic request-response pattern.
- Self-Reference (Recursion): The most interesting part is 5: message 5. The arrow originates from and points back to Object N-1. In UML, this represents a recursive call or an internal operation where an object handles a task by calling its own method.
- Upstream Propagation: Finally, Object N-1 sends 6: message 6 back to Object 1 (via the link established by message 2), and concludes with 7: message 7 returning to the original caller.
Why Use Visual Paradigm UML + AI?
Manually drawing complex links and managing message numbering (especially when refactoring a diagram) can be tedious. Modern system architecture relies on the synergy between Visual Paradigm UML and AI integration.
By integrating AI into your UML modeling workflow, you transform the tool from a passive drawing board into an active collaborator:
- Automatic Layout Optimization: AI algorithms can instantly re-arrange your objects to minimize link crossings, ensuring your Communication Diagram remains readable even as the system grows.
- Intelligent Code Generation: Instead of drawing the diagram first and coding later, you can describe your system in natural language. The AI generates the Communication Diagram, and then generates the corresponding source code (Java, C#, Python) that respects the object interactions.
- Refactoring Assistant: If you decide to add a new object (e.g., a “Cache Layer”), the AI can analyze the existing diagram and suggest how to update the message numbering and links automatically.
Best Practices for Modeling
To ensure your diagrams are effective for team collaboration:
- Keep Links Simple: Only draw a link between two objects if they actually communicate. If Object A talks to Object B, and B talks to C, but A never talks to C, do not draw a link between A and C.
- Focus on Structure: Use this diagram to explain the roles of the objects. If you are trying to explain the exact timing (e.g., “Wait 5 seconds before retry”), switch to a Sequence Diagram.
- Label Clearly: Always label the message content clearly (e.g., “calculateTax()”) rather than just generic terms.
By mastering Communication Diagrams and leveraging the power of AI-assisted modeling, you can design systems that are not only robust but also easy to understand and maintain.
Related posts:
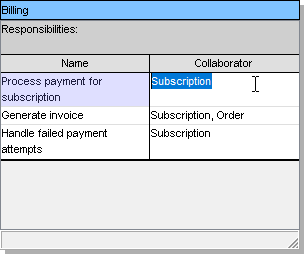 Mastering CRC Modeling: Refining System Architecture with Visual Paradigm and UML
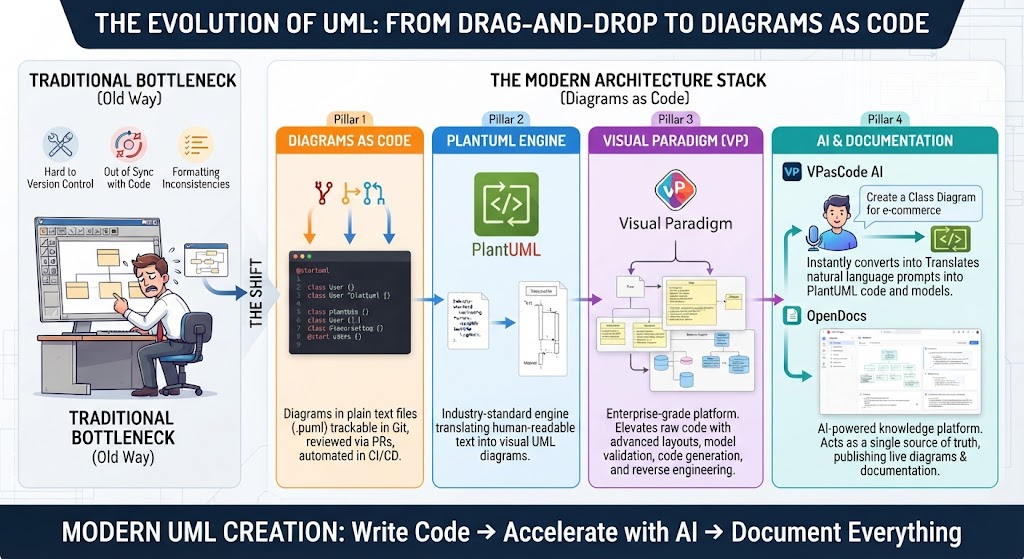 The Evolution of UML: Mastering the Modern Architecture Stack from Drag-and-Drop to Diagrams as Code
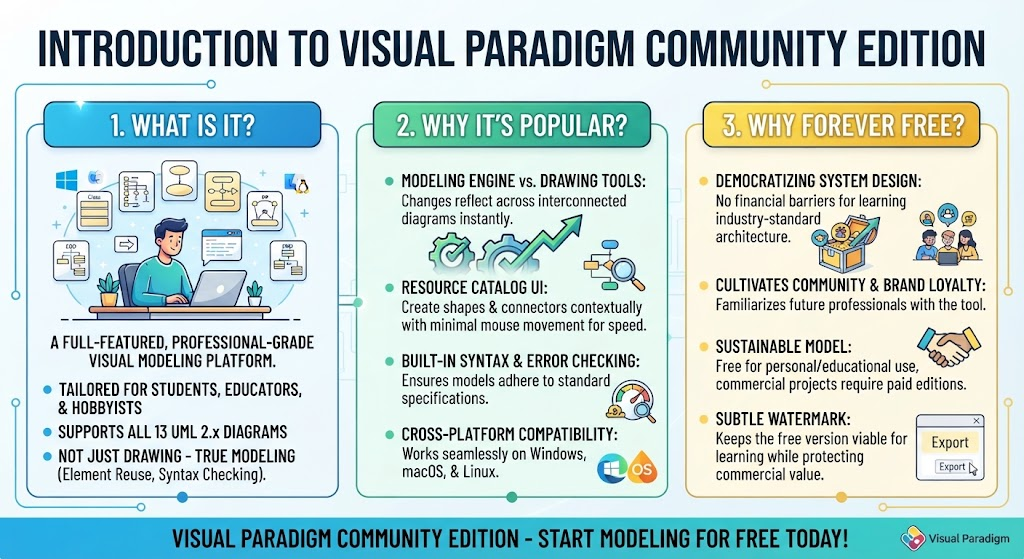 Mastering System Design: A Deep Dive into Visual Paradigm Community Edition
 Mastering Part-Whole Relationships in UML: Aggregation vs. Composition