


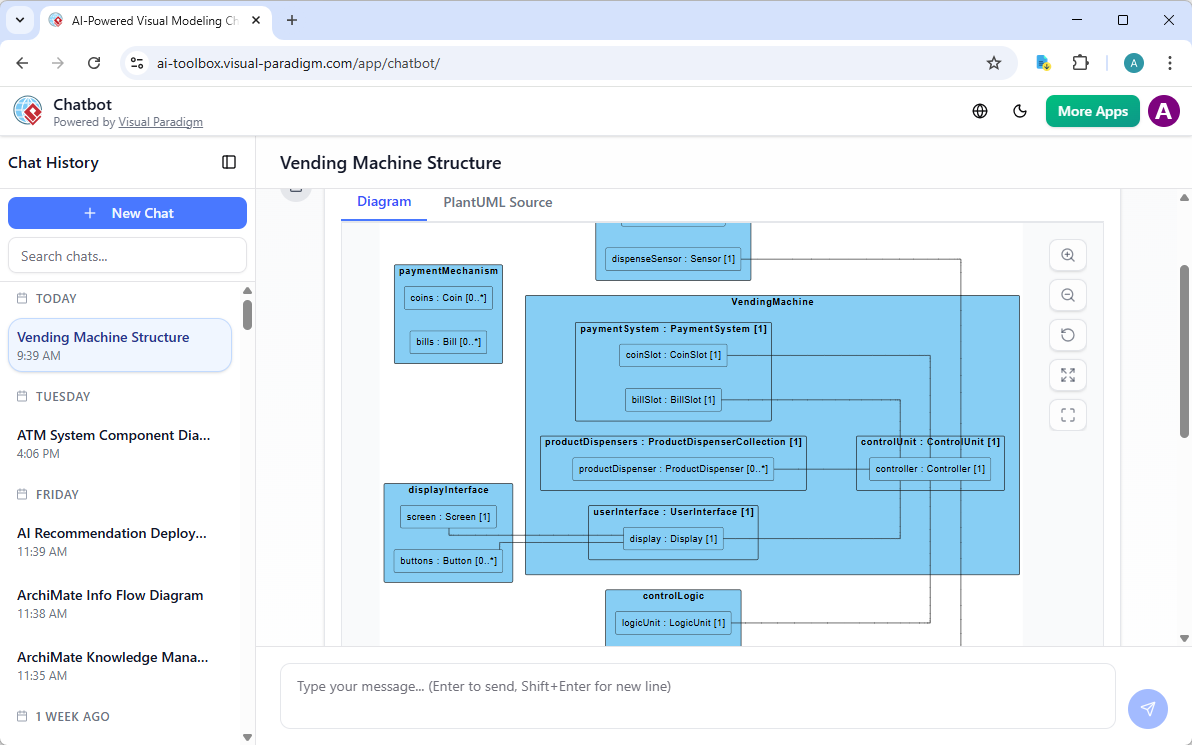
The landscape of software engineering is shifting from manual drawing to conversational modeling. The screenshot above illustrates a powerful workflow: using an AI Chatbot to instantly generate a Component Diagram for a Vending Machine system. This tutorial breaks down the architecture shown in the image, explains the underlying modeling concepts, and demonstrates how to interpret the resulting PlantUML code.
1. The Modeling Concept: Component Diagrams
A Component Diagram is a structural UML diagram that describes the organization and relationships of components in a system. It is a crucial tool for visualizing the “black box” architecture of software—focusing on what a part does rather than how it is implemented internally.
In the context of the Vending Machine shown, the diagram decomposes the system into manageable, reusable units:
- Components (The Boxes): Represent physical or logical parts of the system (e.g.,
paymentSystem,controlUnit,productDispensers). - Interfaces (The Lines): The lines connecting the boxes represent the interfaces. In this diagram, a line signifies that one component requires a specific service or interface provided by another.
- Instances (The Numbers): Notice the numbers in brackets like
[1]or[0..*]. These represent the multiplicity of the instances within that specific component.
2. Analyzing the Architecture
Let’s deconstruct the specific structure generated by the AI in the screenshot.
The Core Controller
The central component is controlUnit. In almost all embedded systems or complex software architectures, there is a central brain. Here, the Controller component acts as the coordinator, managing the logic that decides when to dispense products or process payments.
Interaction Layers
The diagram shows a clear separation of concerns:
- Input Layer: The
displayInterface(containingscreenandbuttons) and thepaymentMechanism(handlingcoinsandbills) are the ways the user interacts with the system. - Processing Layer: The
controlUnitprocesses the input. - Output Layer: The
productDispensersphysically deliver the item.
3. Decoding the PlantUML Source
The “PlantUML Source” tab in the screenshot reveals the code that generated this visual. This is the “source of truth” for the diagram. Understanding this syntax is vital for refining the model.
Here is the raw code logic represented in the diagram, formatted for clarity:
@startuml
title Vending Machine Structure

component "paymentMechanism" as PaymentMech {
  "coins" : Coin [0..*]
  "bills" : Bill [0..*]
}

component "VendingMachine" as MainSystem {
  component "paymentSystem" : PaymentSystem [1]
  component "productDispensers" : ProductDispenserCollection [1]
  component "controlUnit" : ControlUnit [1]
  component "userInterface" : UserInterface [1]

  ' Internal wiring
  MainSystem "paymentSystem" ..> MainSystem "controlUnit"
  MainSystem "productDispensers" ..> MainSystem "controlUnit"
}

component "displayInterface" as Display {
  "screen" : Screen [1]
  "buttons" : Button [0..*]
}

component "controlLogic" as Logic {
  "logicUnit" : LogicUnit [1]
}

' External connections
MainSystem ..> PaymentMech
MainSystem ..> Display
MainSystem ..> Logic
@enduml
4. The AI Workflow: Prompt to Diagram
The image demonstrates the “AI Chatbot” feature of Visual Paradigm. The workflow typically follows these steps:
- Natural Language Input: The user types a prompt like “Generate a component diagram for a vending machine with payment and dispensing logic.”
- Concept Extraction: The AI analyzes the text to identify entities (User, Coin, Dispenser) and relationships (Pays, Dispenses).
- Structural Mapping: The AI maps these entities to UML Component notation, assigning names like
paymentSystemorcontrolUnit. - Visualization: The code is rendered into the blue boxes and lines seen in the screenshot.
- Refinement: As noted in the supplementary text, the results can be refined in the “Desktop or Online” editor for engineering accuracy.
5. Next Steps for Engineers
While the AI provides an excellent baseline, an engineer’s role is to refine this architecture. Consider the following refinements to the diagram shown:
- Refine Multiplicity: Does the
VendingMachinereally have exactly[1]payment system? What if it supports multiple payment gateways? Change the multiplicity to[0..n]. - Define Interfaces: Currently, the lines are generic. In a detailed design, you would label these lines with specific interface names, such as
startDispense()oracceptPayment(). - Add Deployment: You could extend this by adding a Deployment Diagram to show where the
controlUnithardware lives versus where thelogicUnitsoftware resides.
By leveraging AI tools to generate this initial structure, you save significant time on the “drafting” phase, allowing you to focus on the complex logic and system constraints.
Related posts:
 Mastering Enterprise Architecture: Building a Unified Ecosystem with Visual Paradigm
 Mastering BPMN Swimlanes: A Visual Guide to Process Responsibilities
 Mastering BPMN: A Step-by-Step Guide to the Order-to-Cash Process Diagram
 Mastering BPMN: A Comprehensive Guide to Process Modeling Elements & Best Practices