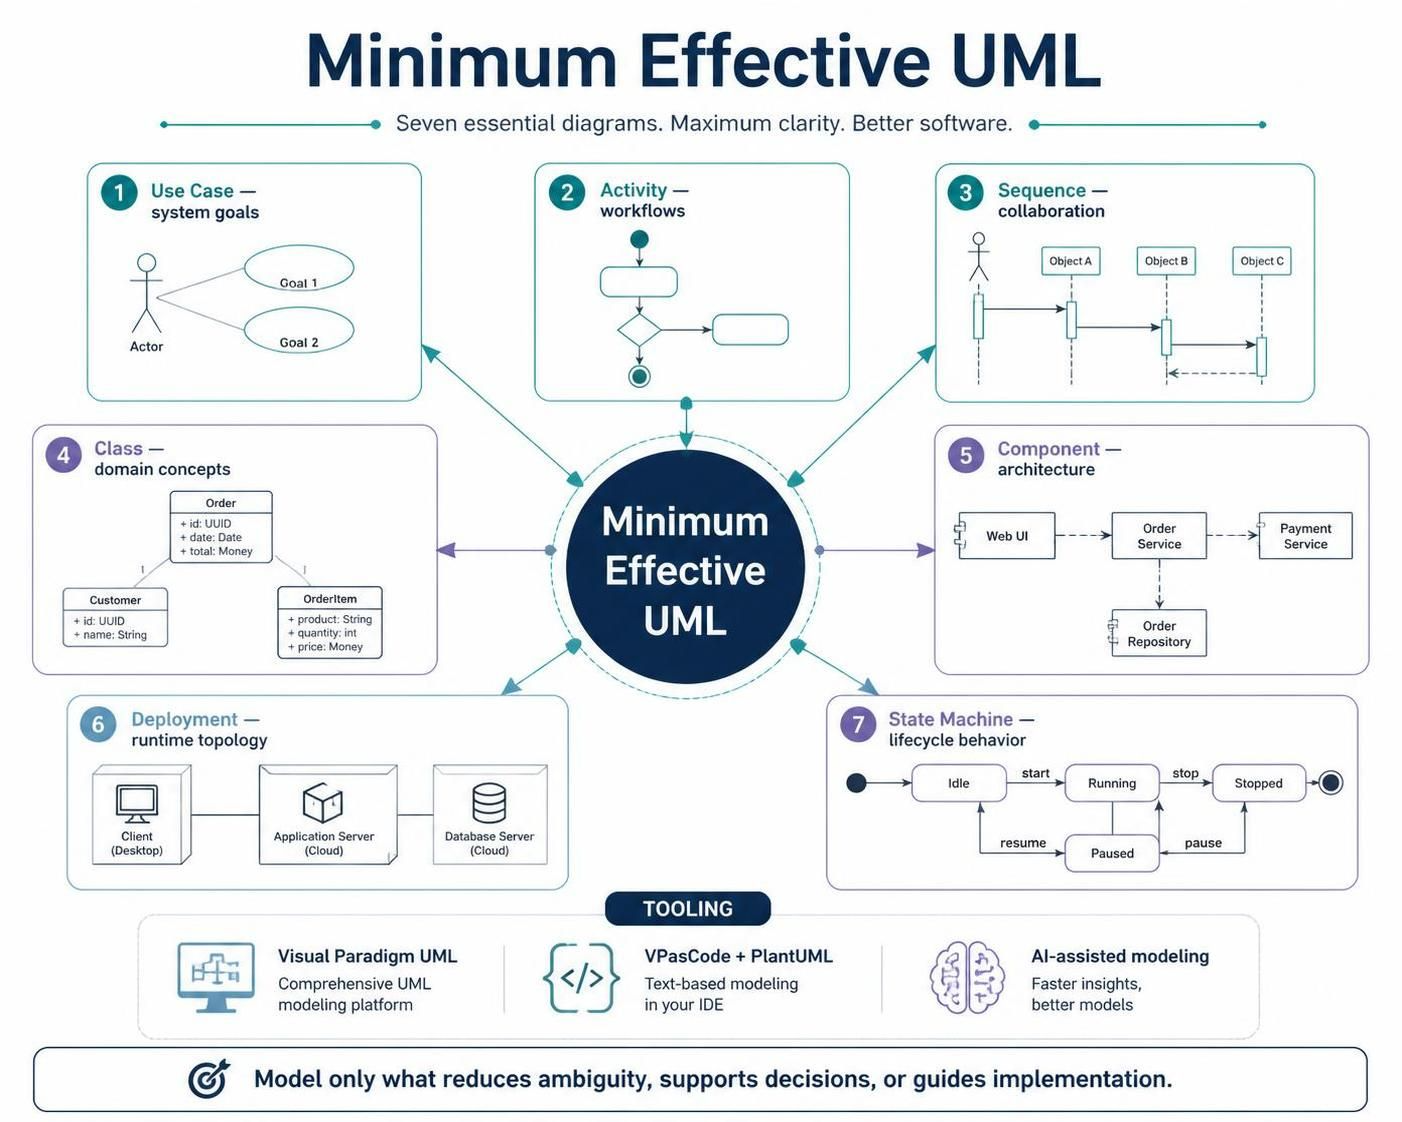
In the world of software engineering, the temptation to model every possible aspect of a system is strong. However, the philosophy of Minimum Effective UML argues for a different approach: creating the smallest set of clear, maintainable models that help a team make better engineering decisions. This guide breaks down the seven essential diagram types that form the backbone of practical system architecture, from defining goals to mapping runtime topology.
1. Use Case Diagrams: System Goals
The journey begins with understanding who uses the system and what they want to achieve. Use Case diagrams are the primary tool for capturing functional requirements at a high level.
- Actors: Represent users or external systems that interact with the software.
- Use Cases: Represent specific goals or functions (e.g., “Place Order” or “Generate Report”).
- Relationships: Show how actors connect to goals.
By focusing on goals rather than implementation details, these diagrams ensure that the entire team aligns on the system’s purpose before writing a single line of code.
2. Activity Diagrams: Workflows
Once goals are defined, we need to understand the how. Activity diagrams map out the logic, decisions, and parallel flows of a process. They are essentially flowcharts tailored for software logic.
@startuml
start
:User Login;
if (Credentials Valid?) then (yes)
  :Fetch User Profile;
  :Display Dashboard;
else (no)
  :Show Error Message;
  stop
endif
stop
@enduml
These are crucial for validating complex business rules and identifying potential bottlenecks in user flows.
3. Sequence Diagrams: Collaboration
While activity diagrams show the “what” of a flow, Sequence Diagrams show the “when” and “how” of object interactions over time. They are the industry standard for visualizing the temporal logic of a request.
- Lifelines: Vertical dashed lines representing objects or actors.
- Messages: Arrows indicating method calls or data exchanges.
- Activation Bars: Rectangles on the lifeline showing when an object is actively performing a task.
This diagram type is indispensable for debugging race conditions and ensuring that components talk to each other correctly.
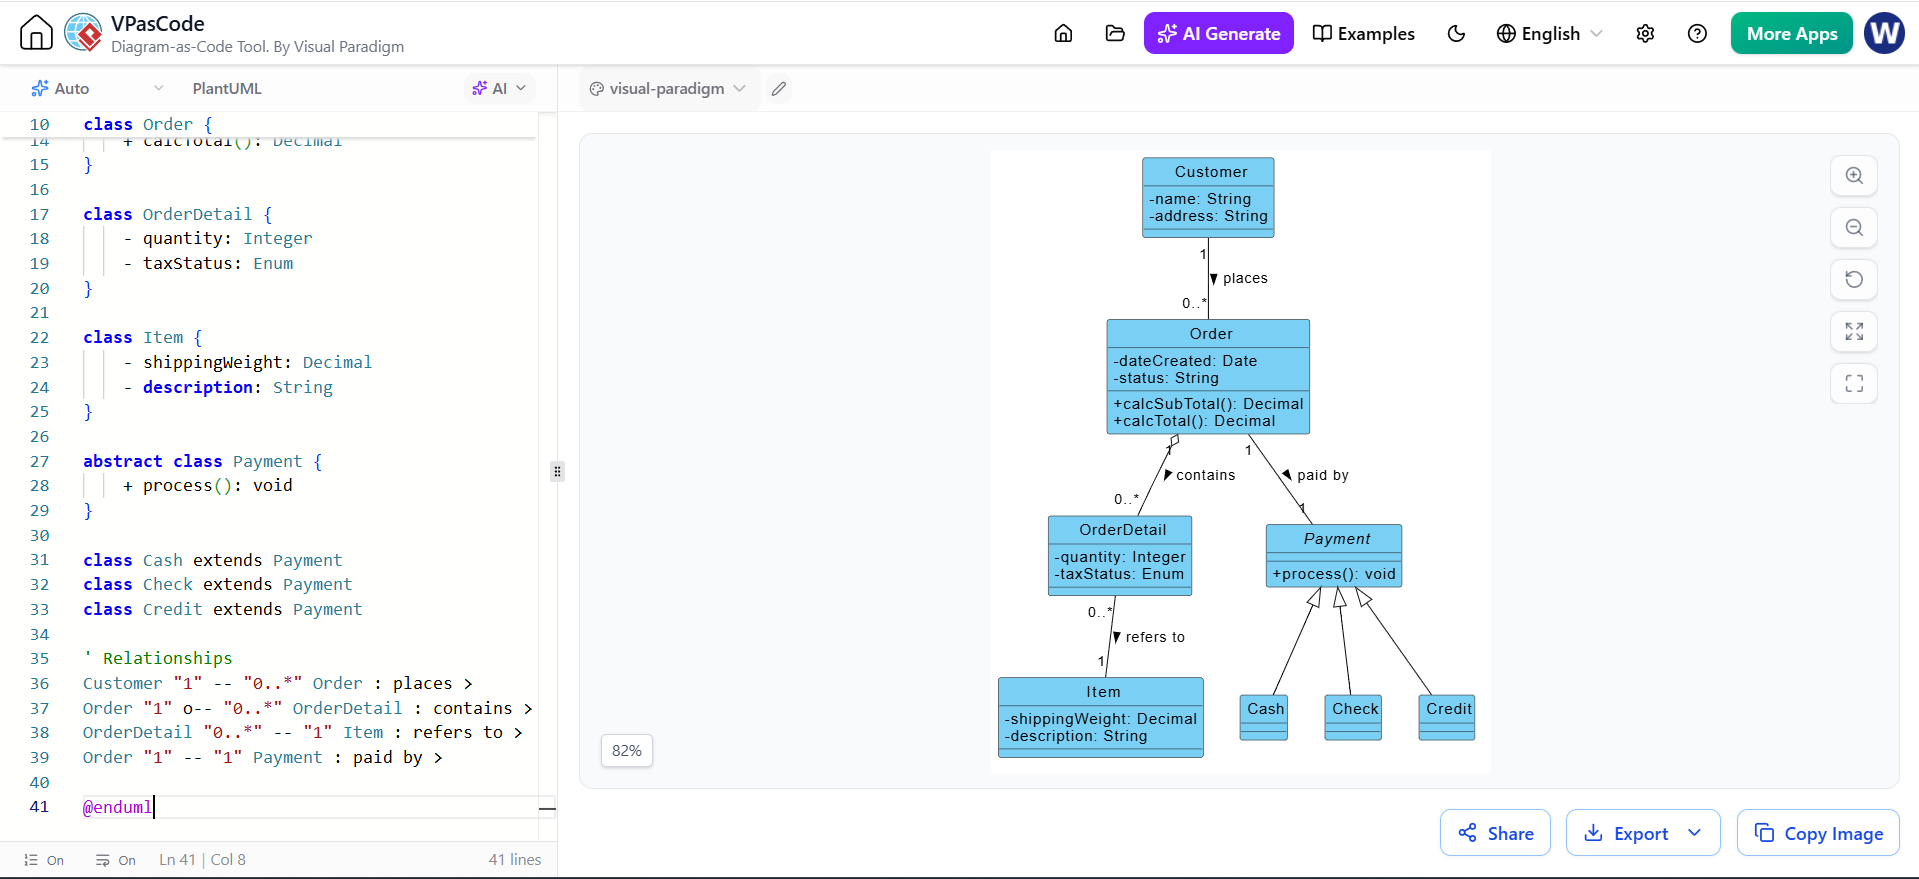
4. Class Diagrams: Domain Concepts
At the heart of object-oriented design lies the Class Diagram. It defines the static structure of the system—the data, the entities, and the relationships between them.
@startuml
class Order {
  +id: UUID
  +date: Date
  +total: Money
}

class Customer {
  +id: UUID
  +name: String
}

class OrderItem {
  +product: String
  +quantity: int
  +price: Money
}

Customer "1" -- "1..*" Order
Order "1" -- "1..*" OrderItem
@enduml
Class diagrams serve as the blueprint for database schemas and the foundation for your codebase’s object hierarchy.
5. Component Diagrams: Architecture
As systems grow, they must be broken down into manageable modules. Component Diagrams illustrate the high-level architecture, showing how subsystems or services interact.
- Interfaces: Define how components communicate (lollipop notation).
- Ports: Define specific connection points.
- Dependencies: Show which components rely on others.
This view is critical for microservices architecture, defining boundaries between services like “Web UI,” “Order Service,” and “Payment Service.”
6. Deployment Diagrams: Runtime Topology
Code must run somewhere. Deployment Diagrams map the physical or virtual hardware architecture. They show nodes (servers, devices) and the artifacts (software binaries, databases) deployed on them.
@startuml
package "Cloud" {
  node "App Server" {
    artifact "OrderService.jar"
  }
  node "DB Server" {
    artifact "PostgreSQL"
  }
}
node "Client (Desktop)" {
  artifact "WebUI.html"
}
WebUI.html --> AppServer
@enduml
This is the “where” of your system, essential for DevOps planning and infrastructure provisioning.
7. State Machine Diagrams: Lifecycle Behavior
Some entities have complex life cycles that cannot be captured by a simple flowchart. State Machine Diagrams (or Statecharts) define the lifecycle of an object, detailing how it transitions between states in response to events.
For example, an Order might transition from Idle to Running, then to Paused, or directly to Stopped. This ensures that the system handles edge cases, such as an order being paused and resumed later, correctly.
The Tooling Ecosystem
To implement Minimum Effective UML effectively, modern teams often utilize a hybrid toolset:
- Visual Paradigm: The comprehensive graphical modeling platform used for heavy lifting, traceability, and documentation.
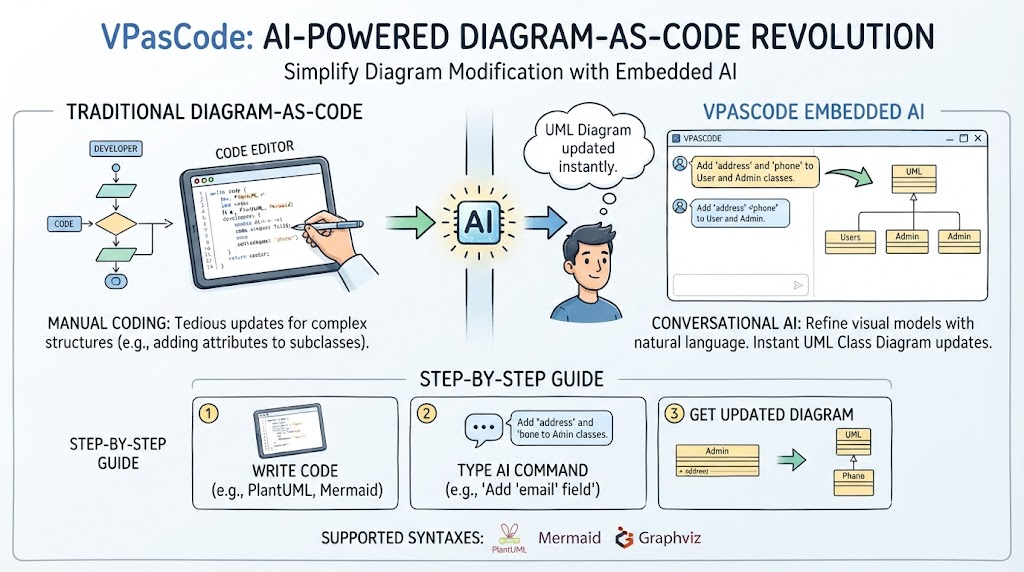
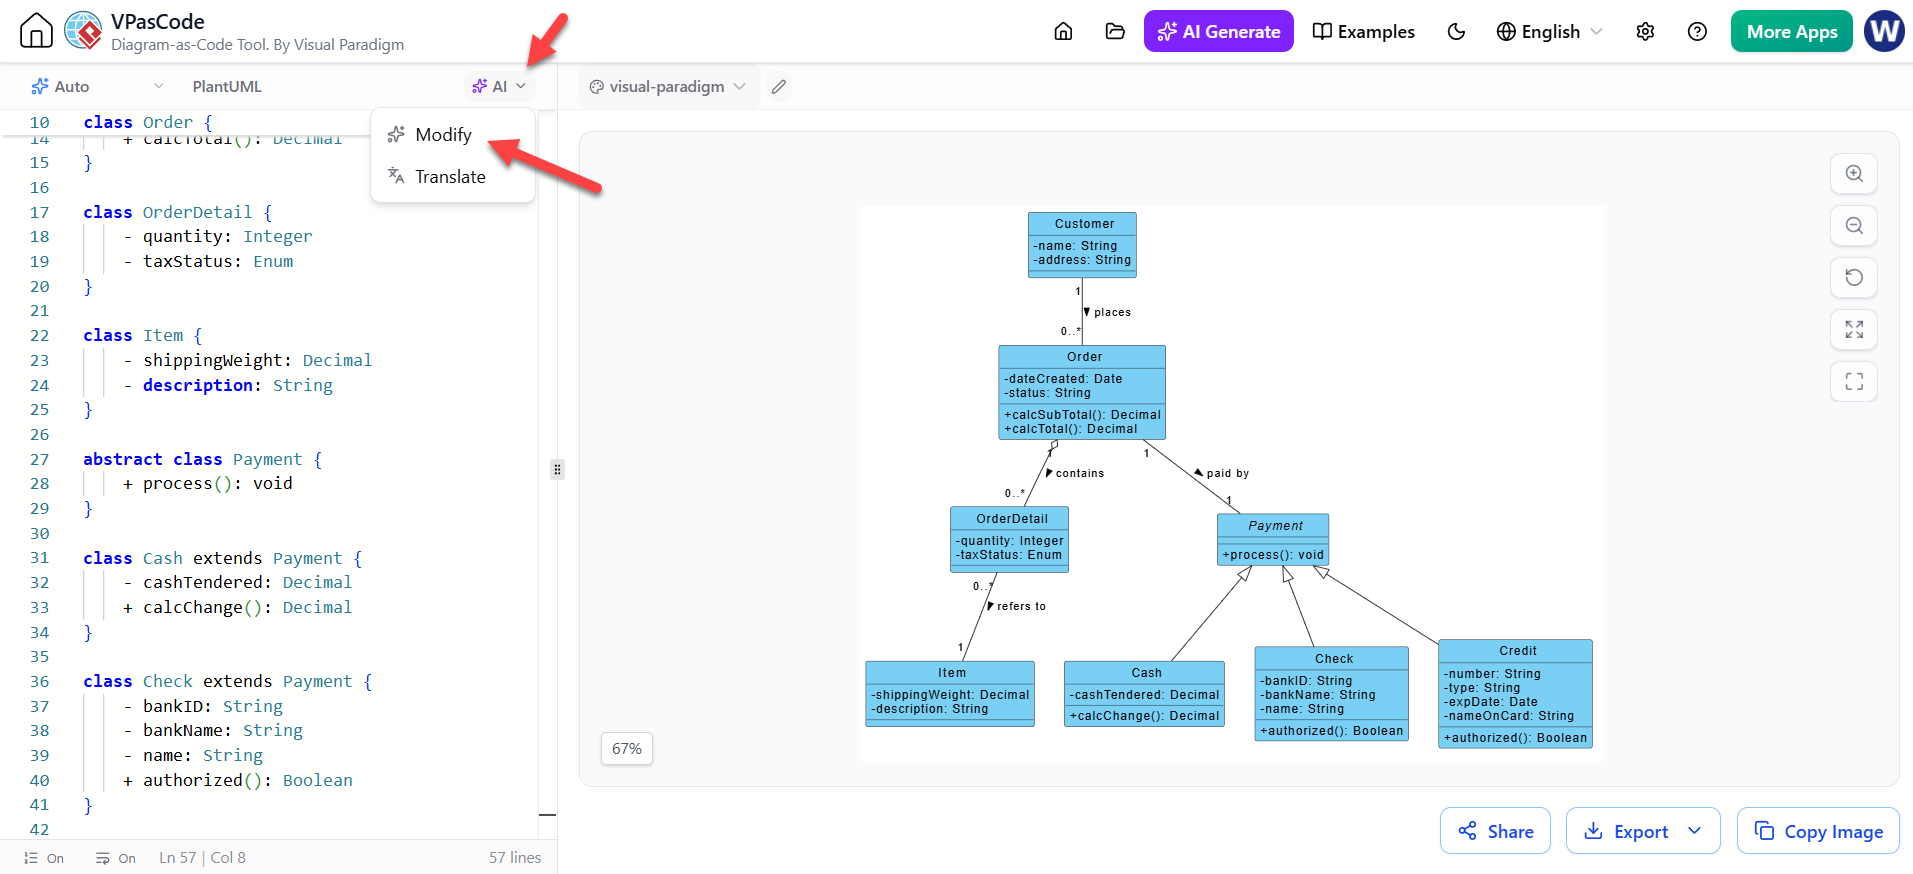
- VPasCode & PlantUML: Text-based modeling tools that allow diagrams to be version-controlled alongside source code in your IDE.
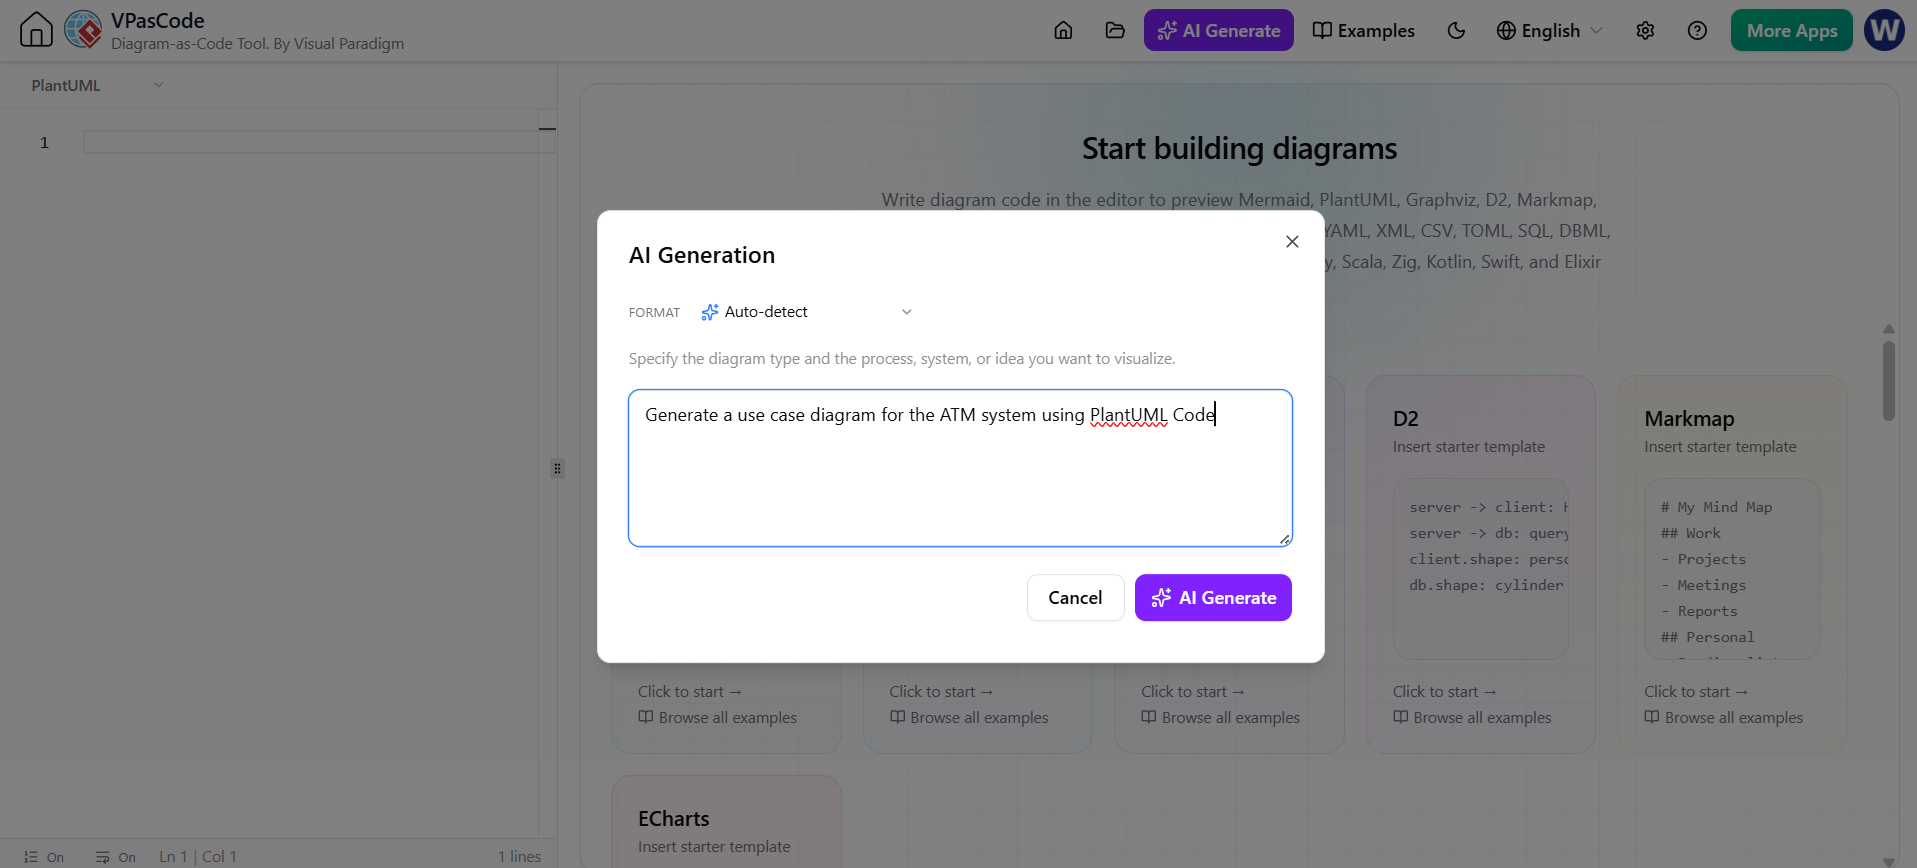
- AI-Assisted Modeling: Using AI to draft diagrams quickly, provided the output is validated against real requirements.
Conclusion
The goal of Minimum Effective UML is not to produce more diagrams, but to reduce ambiguity. By mastering these seven core diagram types, you ensure that your team maintains a clear vision of the system’s goals, logic, structure, and deployment.