In the world of software development, bridging the gap between complex business process modeling (BPMN) and agile user story writing is a critical skill. This tutorial explores the systematic approach to translating technical process diagrams into actionable user requirements. By visualizing the relationship between Process Actors, BPMN Tasks, and Business Outcomes, teams can ensure that every piece of code built actually serves a strategic business goal.
The Anatomy of a Translated Process
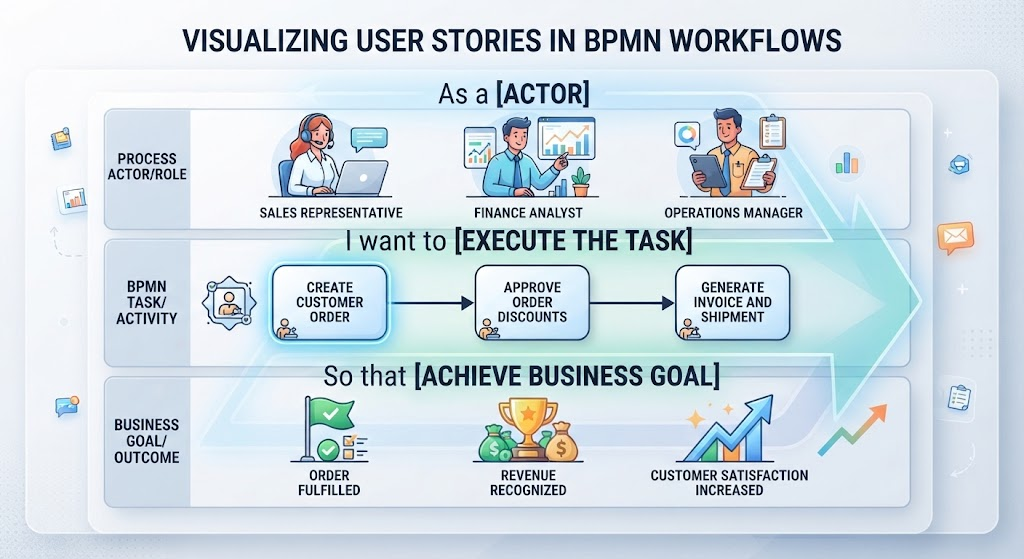
The core of this methodology lies in deconstructing a linear process flow into a structured narrative. As illustrated in the visual guide, we map three distinct layers of information to create a cohesive story. Let’s break down the architecture of this translation process.
1. The Actor Layer: Defining “Who”
The first step in translating a BPMN diagram is identifying the Process Actor/Role. In a BPMN diagram, these are represented by Lanes or Pools. Each distinct actor interacting with the system represents the “As a…” portion of the user story template.
Consider the top section of the diagram. We see three distinct roles driving the process:
- Sales Representative: The initial entry point for customer interactions.
- Finance Analyst: The gatekeeper for financial validation.
- Operations Manager: The executor of physical logistics.
Identifying these roles early ensures that the user stories are assigned to the correct stakeholders during the sprint planning phase.
2. The Task Layer: Defining “What”
Once the actors are defined, we look at the BPMN Task/Activity associated with them. These are the specific boxes or circles within the BPMN flowchart. In the example provided, the workflow is a linear progression:
- Create Customer Order
- Approve Order Discounts
- Generate Invoice and Shipment
These technical tasks are not just checkboxes; they are the functional requirements. When converting these to user stories, we use the “I want to…” format to describe the action the actor must perform.
3. The Outcome Layer: Defining “Why”
Perhaps the most crucial part of this translation is the bottom layer: the Business Goal/Outcome. In BPMN, this is often represented by the End Events or the overall value stream. However, in Agile, we need to be explicit about the benefit.
The visual guide maps the technical tasks to tangible business metrics:
- Order Fulfilled: The immediate result of the Sales Representative’s action.
- Revenue Recognized: The financial validation of the Finance Analyst’s approval.
- Customer Satisfaction Increased: The ultimate success metric of the Operations Manager’s delivery.
Step-by-Step Translation Process
Ready to apply this to your own diagrams? Follow this step-by-step process to convert a complex BPMN chart into a backlog of user stories.
Step 1: Analyze the BPMN Diagram and Identify Scopes
Trying to write a single massive story for an entire BPMN diagram is a recipe for complexity and confusion. Instead, break down the process:
- Break down the process: Look at the end-to-end process and break it down by sub-processes, pools, or major milestones.
- Identify the actors: Look at the lanes or pools. Each distinct actor interacting with the system is a potential “As a [type of user]” in your user story format.
Step 2: Convert Process Activities into User Stories
For each core activity or task in the BPMN diagram, draft a user story using the standard Mike Cohn template:
As a [Actor/Role from BPMN lane], I want to [Execute the task/activity], So that [Achieve the business goal/outcome shown in the end event].
Example Scenario:
If a BPMN task is “Review Loan Application” performed by a “Loan Officer”, the story becomes:
As a Loan Officer, I want to review submitted loan applications so that I can approve or reject them based on company policy.
Why This Visualization Matters
Using a visual model like the one above helps prevent “feature creep.” By explicitly linking the Generate Invoice task to the Revenue Recognized goal, developers understand that the code isn’t just about printing a PDF; it’s about financial compliance and reporting. This alignment between technical modeling and business value is the cornerstone of successful project delivery.