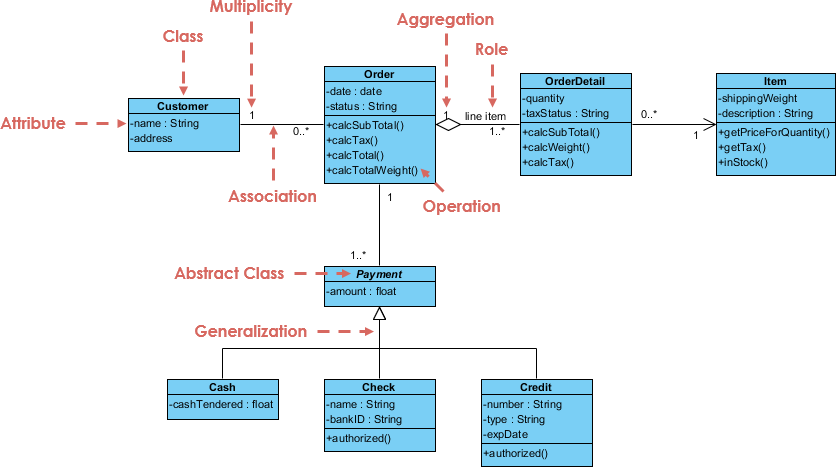
Understanding the static structure of a software system is crucial for any software engineer. The primary tool used to visualize this structure is the Class Diagram, a fundamental component of the Unified Modeling Language (UML). In this comprehensive tutorial, we will explore the anatomy of a class diagram, analyze a complex e-commerce system architecture, and learn how to leverage the powerful Visual Paradigm ecosystem—including its AI Chatbot and VPasCode features—to streamline your modeling workflow.
1. The Anatomy of a Class
At the heart of every class diagram is the Class itself. As illustrated in the diagram below, a class is typically represented as a rectangle divided into three distinct sections:
- The Top Section (Class Name): This contains the identifier for the class (e.g.,
Customer,Order). In professional modeling, class names are usually written in PascalCase (e.g.,Customer). - The Middle Section (Attributes): This area lists the properties or data members of the class. In the provided example, the
Customerclass has name and address. Notice the minus sign (-) prefix, which denotes private visibility in UML. - The Bottom Section (Methods): Also known as operations, these are the functions the class can perform. For instance, the
Orderclass includes operations like+calcTotal(). The plus sign (+) indicates public visibility.
2. Analyzing System Relationships
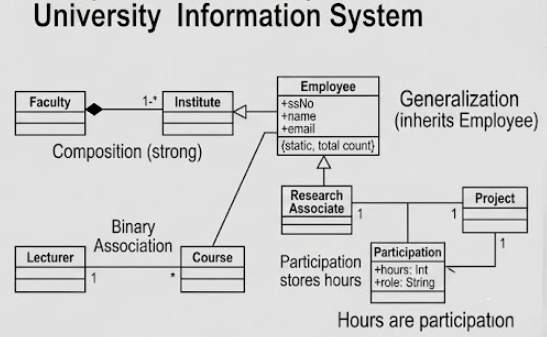
A class diagram is not just a list of classes; it is a map of how these classes interact. The diagram provides a rich example of several key UML relationship types:
Association and Aggregation
An Association represents a structural relationship between objects. In our diagram, Customer is associated with Order. This is depicted by a solid line connecting the two classes.
Crucially, the diagram highlights Aggregation (a specialized form of association) between Order and OrderDetail. This is visually marked by a hollow diamond shape on the Order side. Aggregation implies a “whole-part” relationship where the parts (OrderDetails) can exist independently of the whole (Order) if the relationship is broken. The role name line item further clarifies the specific nature of this connection.
Generalization (Inheritance)
The diagram beautifully illustrates Generalization (inheritance) at the bottom. The Payment class is shown as an Abstract Class (indicated by the italics), serving as a parent to Cash, Check, and Credit. The hollow arrow pointing from the specific payment types to the abstract Payment class signifies that these specific types “extend” the functionality of the parent class.
3. Understanding Multiplicity and Roles
UML class diagrams are precise about how many instances of a class relate to another. This is defined by Multiplicity (or cardinality):
- 0.. (Zero to Many): A Customer can place zero orders, or many orders. This is flexible and common in real-world scenarios.
- 1.. (One to Many): An Order must contain at least one OrderDetail, and can contain many.
- 1 (Exactly One): An OrderDetail is associated with exactly one Item.
Roles are names assigned to the ends of an association to clarify the relationship from the perspective of the connected class. For example, the role line item describes what an OrderDetail is from the perspective of an Order.
4. The Visual Paradigm Ecosystem: Modeling with AI
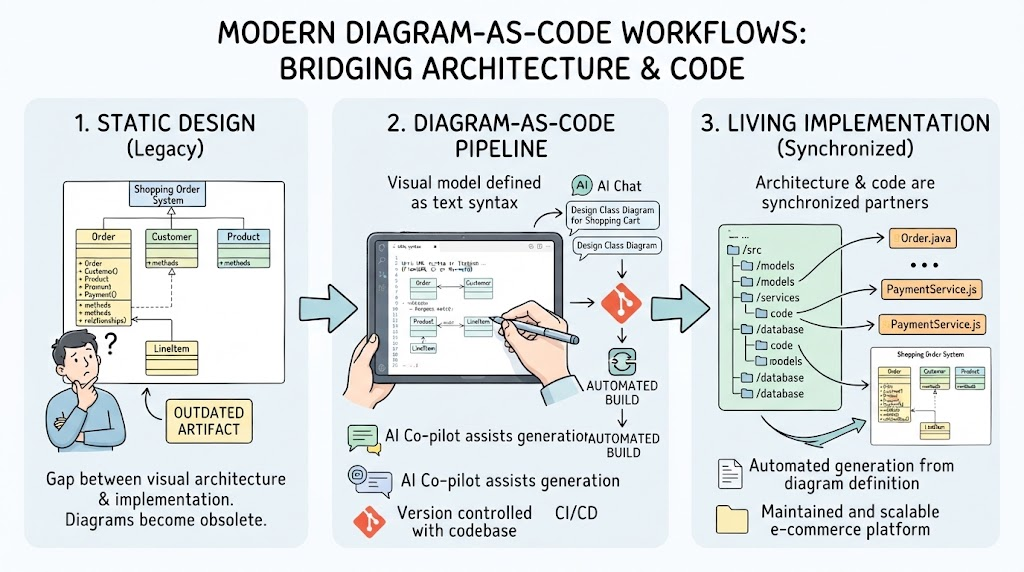
Creating these diagrams manually can be time-consuming. Modern modeling tools like Visual Paradigm integrate advanced AI capabilities to accelerate the design process. Here is the recommended workflow using the tool suite:
A. Visual Paradigm UML + AI Chatbot
The AI Chatbot acts as an intelligent assistant within the tool. Instead of manually dragging and dropping classes, you can converse with the AI to generate your model.
Workflow:
- Initiate Conversation: Open the AI Chatbot within Visual Paradigm.
- Prompt Engineering: Provide a natural language description of your system. For example: “Create a UML class diagram for an e-commerce system with Customers, Orders, and Payment types like Cash and Credit.”
- Refinement: The AI will generate the initial diagram. You can then ask follow-up questions like, “Change the relationship between Order and OrderDetail to be an aggregation” to refine the model instantly.
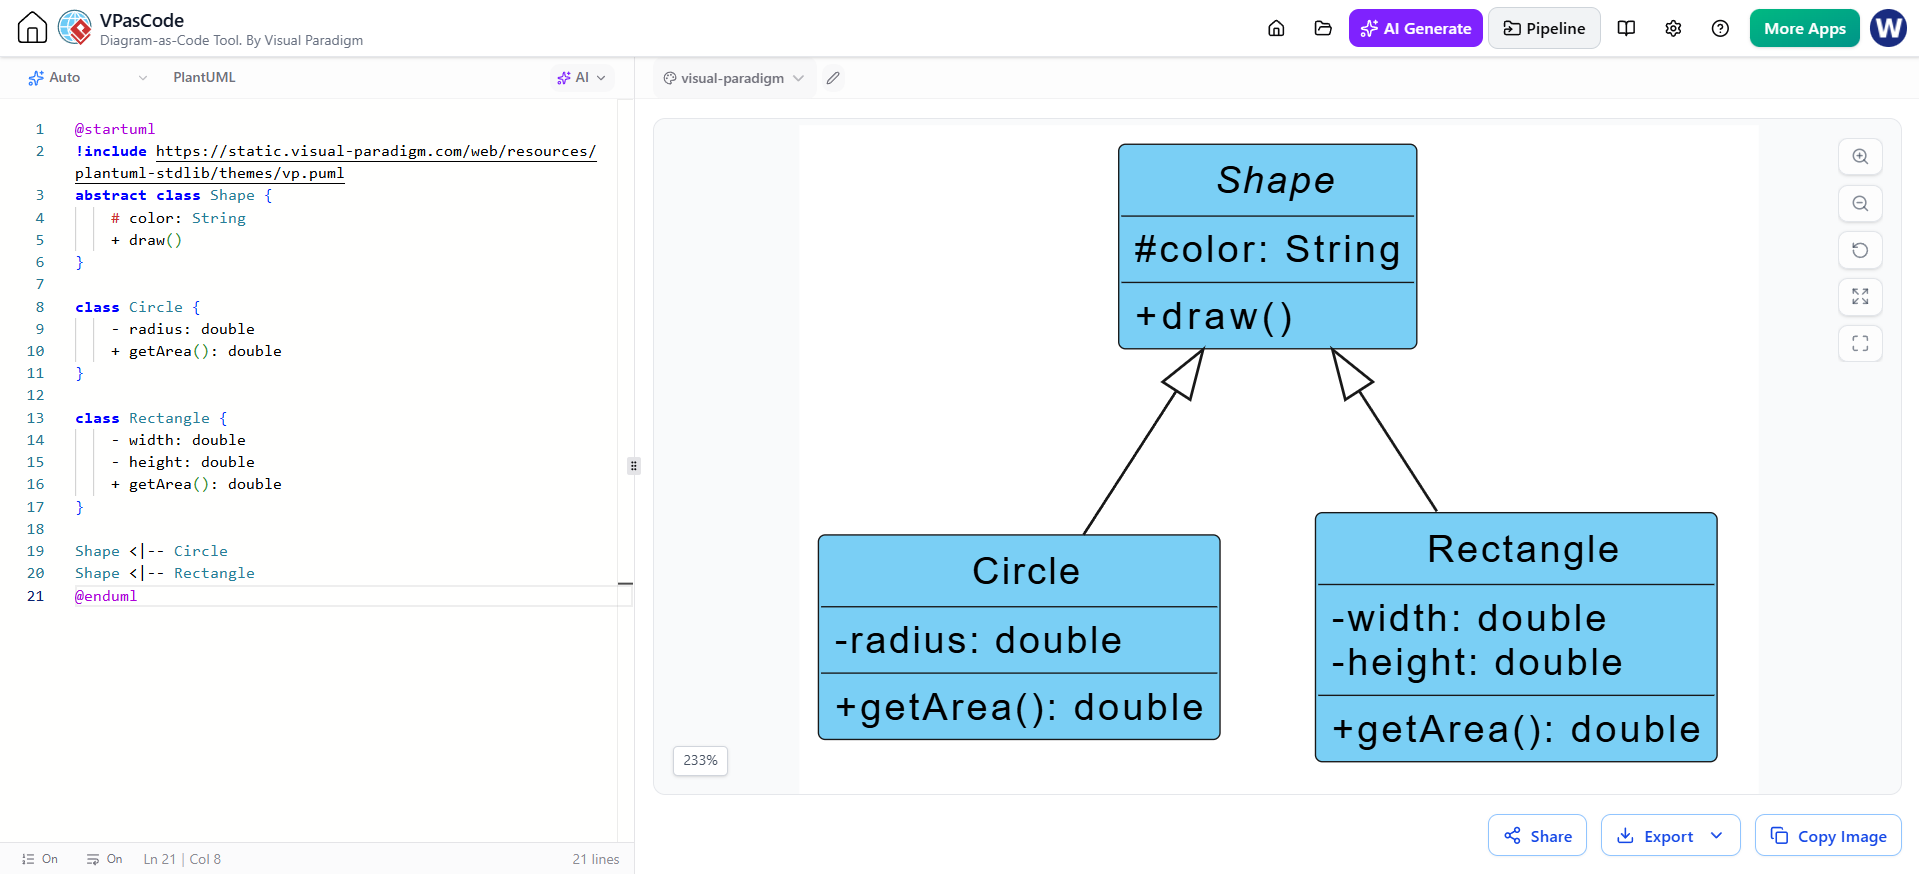
B. VPasCode: From Diagram to Logic
Once your diagram is complete, the next logical step is often to generate the actual code structure. Visual Paradigm’s VPasCode feature bridges the gap between design and implementation.
Workflow:
- Selection: Select the classes in your diagram that you wish to implement.
- Generation: Use the “Generate Code” or VPasCode feature to automatically create skeleton code in your preferred language (Java, C#, Python, etc.).
- Execution: The AI can further assist in writing the logic for the methods defined in your diagram (e.g., the logic inside
calcTotal()), ensuring the code matches the model perfectly.
Conclusion
Class diagrams are the blueprints of object-oriented systems. By understanding the interplay between attributes, operations, and relationships like Association and Generalization, you can design robust software architectures. By leveraging tools like Visual Paradigm with its AI Chatbot and VPasCode, you can move from abstract concepts to concrete code with unprecedented speed and accuracy.