In the modern landscape of business operations, clarity is currency. The ability to translate complex organizational workflows into a universally understood visual language is a critical skill for business analysts, process owners, and technical architects. This tutorial explores Business Process Model and Notation (BPMN), the global standard for business process modeling, and demonstrates how to leverage tools like Visual Paradigm to create diagrams that drive operational excellence.
What is BPMN?
BPMN is not merely a drawing tool; it is a standardized graphical notation designed to describe business processes in a way that is readable by all business stakeholders—ranging from business managers to technical developers. By using a standardized set of symbols and rules, BPMN bridges the gap between high-level business strategy and the underlying technical implementation.
When utilizing platforms like Visual Paradigm, which supports the rigorous BPMN 2.0 standards, you ensure that your diagrams are not only visually appealing but also semantically precise. This allows for the automation of processes and the generation of executable code directly from the model.
The Core Architecture of BPMN
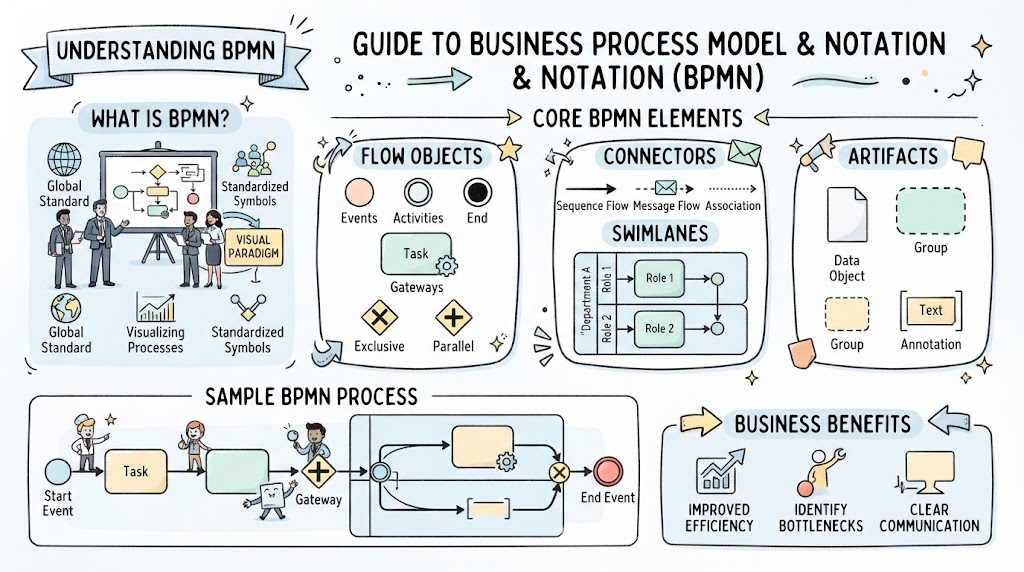
To construct a robust process model, one must understand the fundamental building blocks. BPMN organizes these elements into four primary categories: Flow Objects, Connectors, Artifacts, and Swimlanes. Let’s break down each component.
1. Flow Objects: The Anatomy of a Process
Flow objects are the most common elements in a BPMN diagram. They define the behavior of the process. Think of them as the actors and actions in a play.
- Events: Represented by circles, these signify “something that happens” during the process. They have a start condition (thin border), an intermediate occurrence (double border), or an end state (thick border).
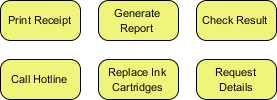
- Activities: Represented by rounded rectangles, these are the work that needs to be done. A Task is the most basic unit of work. In Visual Paradigm, you can expand these into sub-processes to manage complexity.
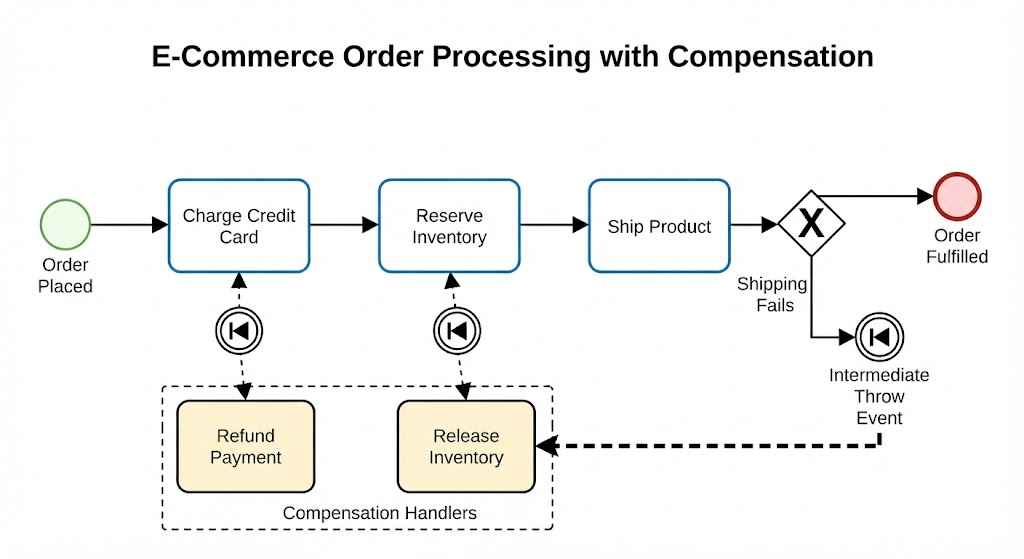
- Gateways: Represented by diamonds, these are the decision points. They control the divergence and convergence of the flow.
- Exclusive Gateway (X): A decision point where only one path is chosen (like an if/else statement).
- Parallel Gateway (Plus sign): A point where the process splits into multiple paths that execute simultaneously.
2. Connectors: The Flow of Control
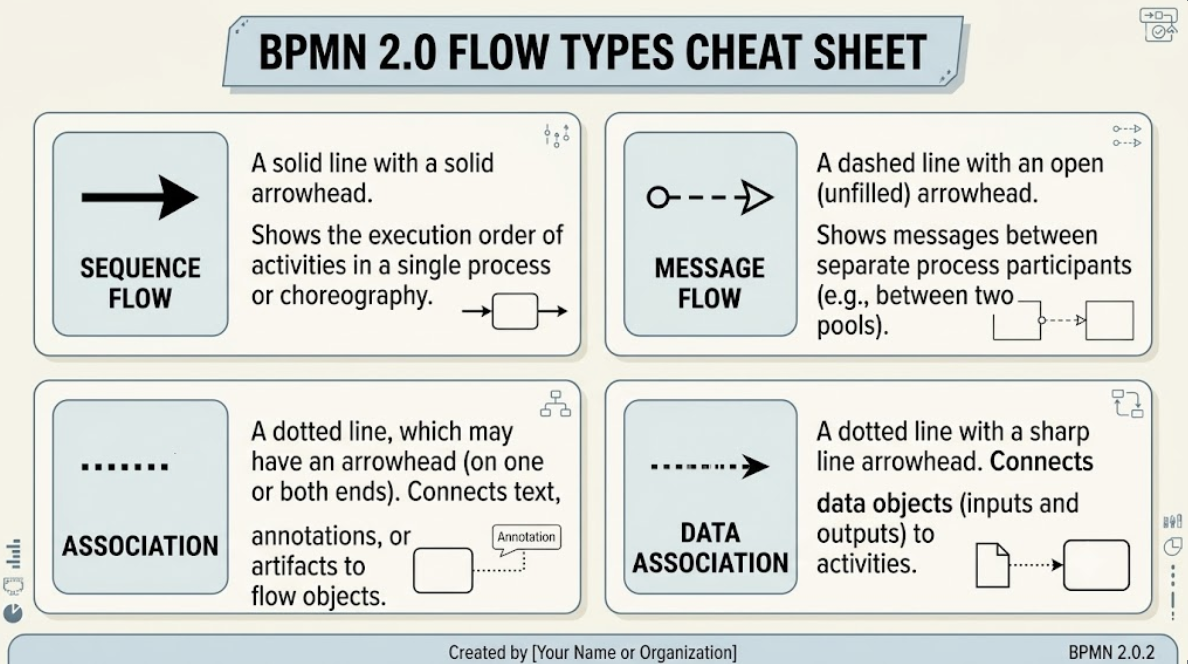
Connectors link the flow objects together to define the sequence of execution. Understanding the difference between these lines is vital for accurate modeling.
- Sequence Flow: A solid line with an arrow indicating the order of activities. It dictates the flow of the process from one activity to the next.
- Message Flow: A dashed line with an open circle at the start and an arrow at the end. This represents the communication between different participants or organizations.
- Association: A dotted line used to link artifacts (like text or data objects) to specific flow objects to provide context.
3. Swimlanes: Organizing Responsibility
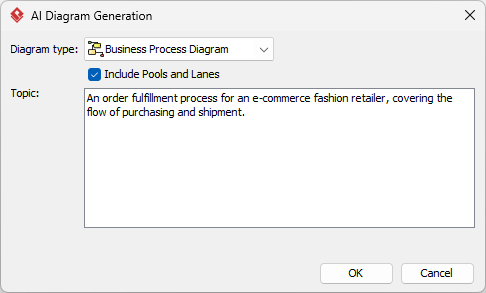
One of the most powerful features of BPMN is the Swimlane. Swimlanes divide the process into horizontal (Pool) or vertical (Lane) sections to represent different roles, departments, or systems.
This visual separation clarifies who is responsible for what. For instance, a “Customer” lane might contain the “Place Order” task, while a “Warehouse” lane contains the “Pack Goods” task. This prevents the “black hole” syndrome where a task appears to just disappear without a clear owner.
4. Artifacts: Adding Context
Artifacts provide additional information to the process without affecting the flow logic.
- Data Objects: Represent the data being used or produced by an activity (e.g., an Invoice or a Purchase Order).
- Groups: A dashed rectangle used to visually group elements, often to indicate a specific phase or boundary, without implying a process flow.
- Annotations: Notes that provide explanatory text for the process.
Case Study: Visualizing a Sample Process
Let’s walk through a simple “Sample BPMN Process” to see these elements in action. Imagine a workflow starting with a user request.
- Start Event: The process begins with a blue circle. This is the trigger. In a real-world scenario, this could be a customer submitting a form.
- Task Execution: The first activity, perhaps “Review Request,” is performed. This is a single unit of work.
- Gateway Decision: The flow hits a gateway (the diamond with the ‘X’). This is a critical decision point. “Is the request valid?”
- If Yes, the process moves forward to the next step.
- If No, the flow might loop back or terminate.
- End Event: The process concludes with a red circle, indicating the successful completion of the workflow.
Business Benefits of BPMN
Why invest time in mastering this architecture? The benefits are tangible and measurable:
- Improved Efficiency: By mapping out processes, you can visually identify redundant steps and optimize the workflow.
- Identify Bottlenecks: Complex processes often have hidden choke points. BPMN makes these visible, allowing you to address them proactively.
- Clear Communication: It eliminates ambiguity. When a developer and a business manager both look at a BPMN diagram, they should see the exact same logic.
By leveraging Visual Paradigm and adhering to the principles outlined above, you transform abstract business ideas into actionable, executable models that drive real business value.