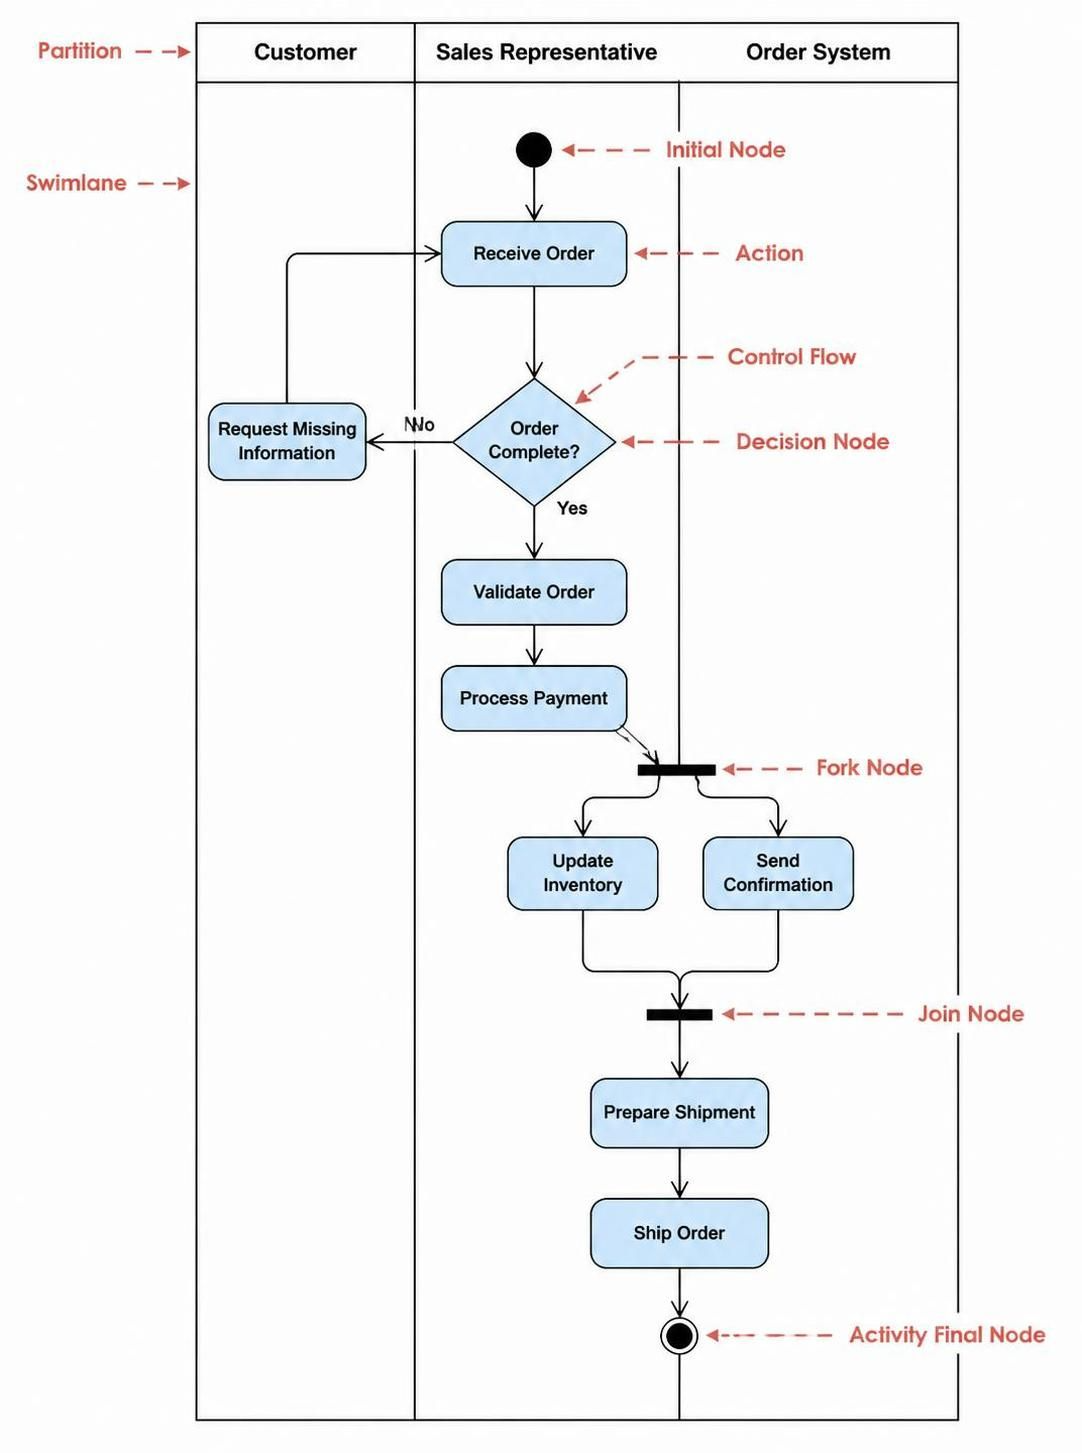
UML Activity Diagrams are the dynamic engine of system modeling. While Use Case diagrams tell you what a system does, and Class diagrams tell you how it is structured, Activity Diagrams reveal how the system behaves over time. They are essentially flowcharts for software, capable of representing complex logic, concurrency, and decision-making processes.
In this tutorial, we will deconstruct a comprehensive Order Processing workflow. By analyzing a diagram divided into swimlanes, we will explore how to model responsibilities, handle loops, and execute parallel tasks within a unified system architecture.
1. The Architecture of Responsibility: Swimlanes
Before diving into the flow, we must understand the context. The diagram utilizes Swimlanes (or Partitions). This is a critical concept for modeling multi-actor systems.
In our Order Processing scenario, the system is divided into three distinct domains:
- Customer: The external actor initiating the interaction.
- Sales Representative: The intermediary handling data entry and validation.
- Order System: The backend infrastructure automating the fulfillment process.
Swimlanes serve a dual purpose: they clarify who is responsible for an action and they visually separate concerns. Notice how the flow crosses boundaries—from the Sales Rep to the System, and back to the Customer. This visualizes the handover of control.
2. The Linear Flow: Actions and Control Flow
The process begins with the Initial Node (the solid black circle). This is the entry point of the workflow, typically triggered by an external event, such as a customer submitting an order.
graph TD
    Start((Start)) --> Receive[Receive Order]
From the start node, the flow moves to the Action node “Receive Order”. In UML, actions are depicted as rounded rectangles. The arrow connecting these nodes is the Control Flow, indicating the sequence of execution.
3. Handling Logic: Decision Nodes and Loops
Real-world processes are rarely linear. They involve branching logic. This is where the Decision Node (the diamond shape) comes into play. The diagram presents a critical validation step: “Order Complete?”
This node splits the flow based on a boolean condition:
- Yes: The workflow proceeds to validation.
- No: The workflow diverts to the Customer swimlane.
When the condition is “No”, the system triggers an action called “Request Missing Information”. The arrow from this action loops back to the “Receive Order” action. This creates a Loop, ensuring data integrity by forcing the user to provide the necessary information before the process can advance.
4. Concurrency: Fork and Join Nodes
One of the most powerful features of Activity Diagrams is the ability to model concurrent (parallel) activities. Once the order is validated and payment is processed, the system doesn’t need to wait to do everything one by one.
At the end of “Process Payment”, we encounter a Fork Node (the thick black bar). This node splits a single flow into multiple concurrent flows. In this scenario, the system immediately branches into two independent tasks:
- Update Inventory: Reducing stock levels.
- Send Confirmation: Notifying the customer.
These two actions run simultaneously. The process does not pause for one to finish before starting the other. However, the system must eventually synchronize these threads. This is achieved via the Join Node (the second thick black bar). The Join Node waits for both the Inventory update and the Confirmation to complete before merging the flows back into a single path to “Prepare Shipment”.
5. Tooling for Collaboration: Visual Paradigm & UML
While the logic of Activity Diagrams is universal, the efficiency of creating them depends heavily on the tooling. Modern modeling platforms like Visual Paradigm (VP) have revolutionized how teams handle these diagrams.
Seamless Integration
Visual Paradigm integrates UML directly into the development lifecycle. Instead of drawing static images in a separate graphics tool, VP allows you to create executable models. This means the diagram you draw is actually a blueprint for the code. If you change the logic in the diagram, the impact analysis helps you understand how it affects the database schema or API endpoints.
Boosting Team Collaboration
Activity diagrams are often the “Rosetta Stone” for cross-functional teams. A developer, a product manager, and a business analyst can all look at the same diagram and understand the workflow. VP enhances this with features like:
- Real-time Co-editing: Multiple stakeholders can view and edit the diagram simultaneously, reducing version control conflicts.
- Collaborative Review: Direct comments on specific nodes (like the “Decision Node”) allow for instant feedback loops during design reviews.
- Exporting to Code: VP can generate skeleton code (Java, C#, etc.) from the Activity Diagram, providing a head start for the engineering team.
Conclusion
By mastering the elements of Swimlanes, Decision Nodes, and Fork/Join logic, you can design robust, bug-free workflows. Whether you are modeling a simple “Place Order” use case or a complex microservices orchestration, Activity Diagrams provide the clarity needed to bridge the gap between business requirements and technical implementation.