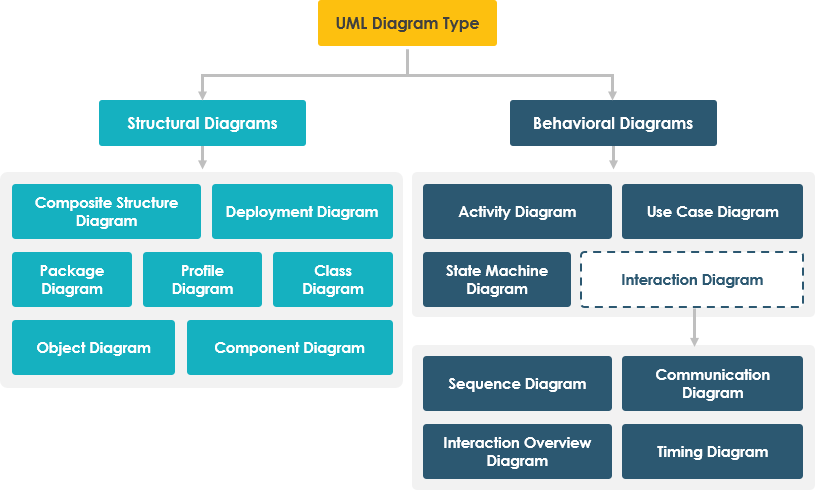
In the complex world of software engineering, clarity is currency. Before a single line of code is written, architects and developers must visualize the blueprint of their system. This is where the Unified Modeling Language (UML) comes into play. UML diagrams are not just technical drawings; they are the heart of communication between stakeholders, designers, and developers.
This tutorial explores the core taxonomy of UML 2, breaking down the two fundamental categories—Structural and Behavioral diagrams—and how they work together to define a robust system architecture.
The Two Pillars of UML
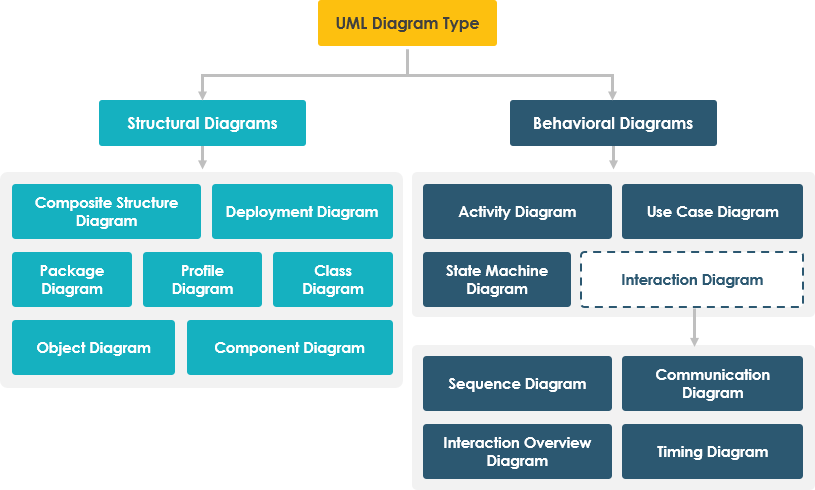
UML diagrams are broadly categorized into two distinct groups based on what they represent in the system lifecycle:
- Structural Diagrams: These are static diagrams. They represent the architecture of the system at a specific point in time. Think of these as the “skeleton” or the “map” of the software.
- Behavioral Diagrams: These are dynamic diagrams. They represent the functionality and the flow of control over time. Think of these as the “muscles” or the “movie” of the software in action.
1. Structural Modeling: The Static Blueprint
Structure diagrams show the static structure of the system and its parts on different abstraction and implementation levels. They illustrate how elements are related to each other without considering the passage of time.
These diagrams represent meaningful concepts of a system, which may include abstract, real-world, and implementation concepts. There are seven primary types of structure diagrams:
The 7 Structural Diagrams
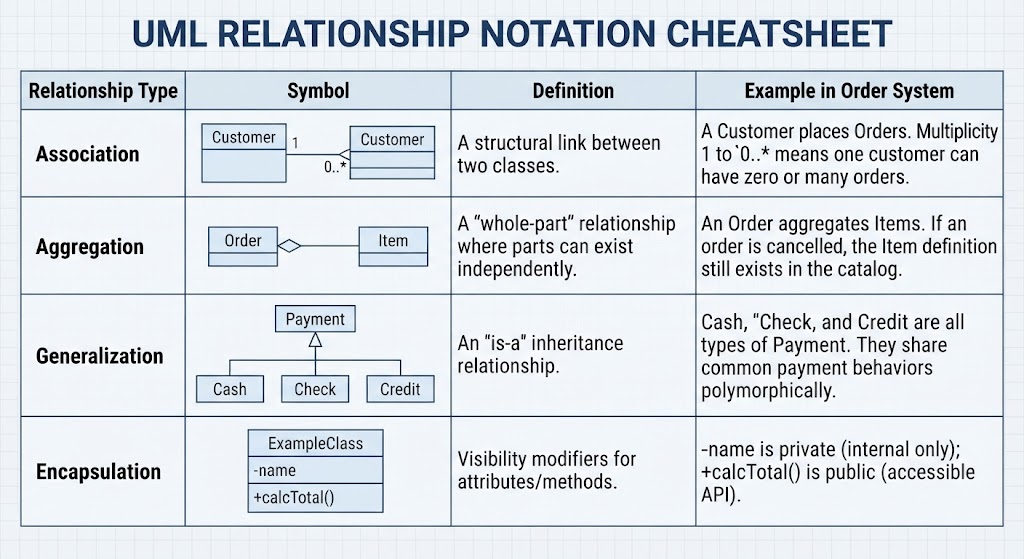
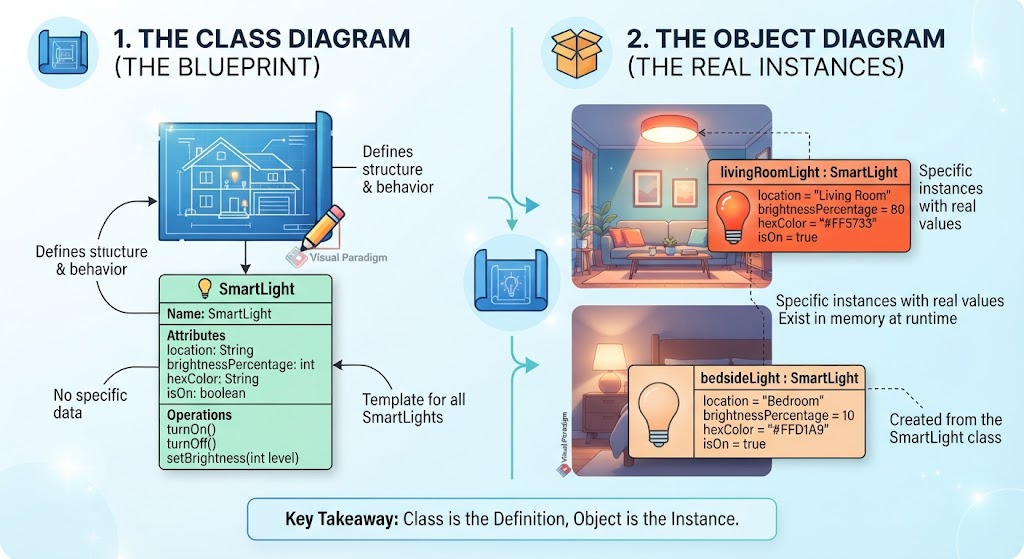
- Class Diagram: The most common diagram, showing the system’s classes, attributes, operations, and the relationships between objects.
- Object Diagram: A snapshot of the system at a specific moment, showing instances of classes and their relationships.
- Component Diagram: Describes the organization and dependencies between higher-level components (like libraries or modules).
- Composite Structure Diagram: Shows the internal structure of a class and the interactions between its parts.
- Deployment Diagram: Maps the physical hardware and software architecture, showing where components are deployed.
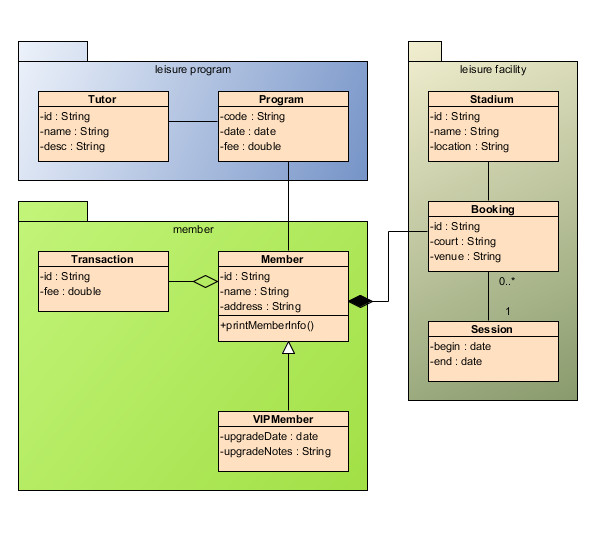
- Package Diagram: Groups elements (like classes or other packages) together to manage complexity and organize the model.
- Profile Diagram: Allows users to extend UML by adding new stereotypes, constraints, and tagged values specific to a domain.
2. Behavioral Modeling: The Dynamic Flow
Behavior diagrams show the dynamic behavior of the objects in a system. They describe the system as a series of changes over time, focusing on the interactions between objects and the state changes they undergo.
The 7 Behavioral Diagrams
- Use Case Diagram: Captures the high-level functional requirements of the system by showing interactions between actors and the system.
- Activity Diagram: Similar to a flowchart, this models the workflow or business process logic.
- State Machine Diagram: Describes the different states an object can be in and the events that cause it to transition from one state to another.
- Sequence Diagram: A detailed interaction diagram that emphasizes the time ordering of messages between objects.
- Communication Diagram: (formerly Collaboration Diagram) Focuses on the relationships and interactions between objects, prioritizing structural organization over time.
- Interaction Overview Diagram: A high-level overview that combines the features of activity diagrams and interaction diagrams.
- Timing Diagram: A specialized interaction diagram that focuses on the timing constraints of messages and state changes.
Recommended Tooling for High-Efficiency Teams
To effectively leverage these diagrams for system architecture, teams require a modern toolset that bridges the gap between design and development. We recommend a unified ecosystem that combines visual modeling with AI-driven efficiency.
The VPasCode Ecosystem
For teams looking to achieve unique and high efficiency in their modeling processes, the following integrated toolset is ideal:
- Visual Paradigm: The industry-standard modeling tool that supports the full spectrum of UML diagrams, from structural to behavioral, with drag-and-drop ease.
- VPasCode: A revolutionary feature that allows for the generation of code directly from your diagrams, ensuring that your model is always synchronized with your source code.
- AI Chatbot: Integrated AI assistants that can help generate diagram templates, explain complex relationships, or suggest optimizations based on best practices.
- OpenDocs Workflow: A collaborative platform for managing documentation and ensuring that the design artifacts are accessible and up-to-date for the entire team.
By combining the theoretical power of UML 2 with a robust, AI-enhanced toolchain, you can transform the architecture process from a static documentation task into a dynamic engine for software development.