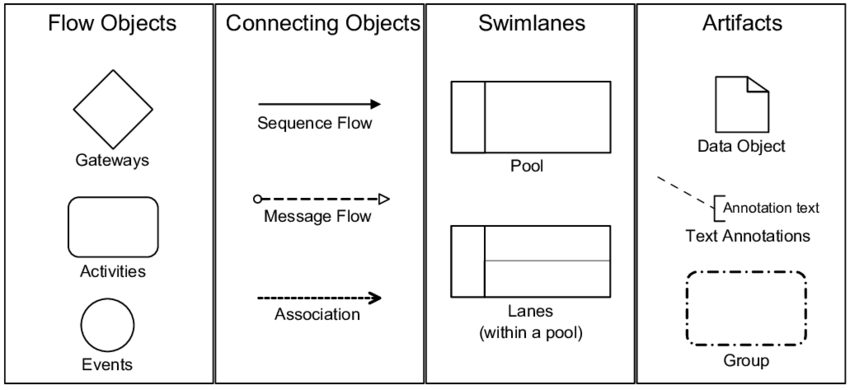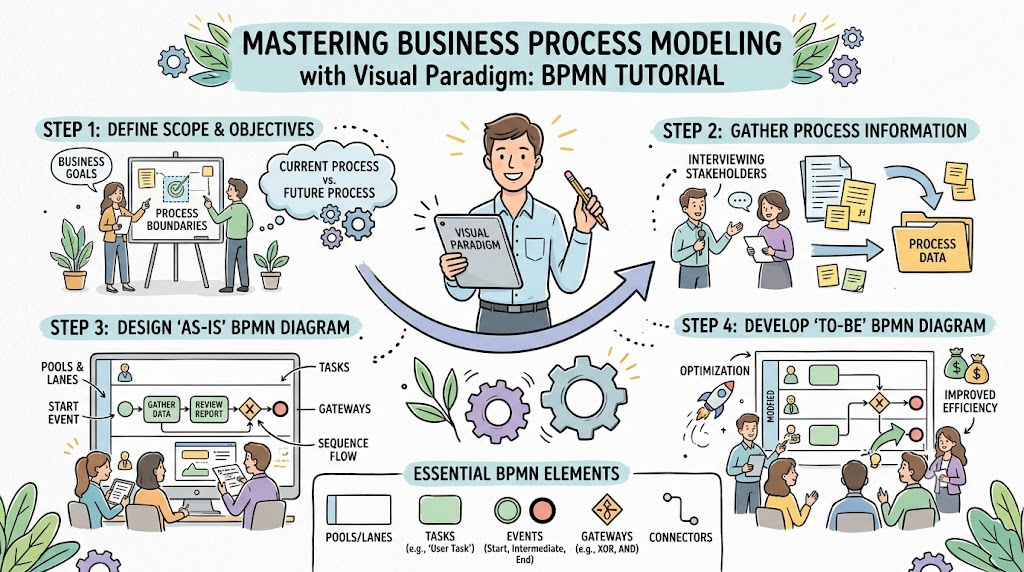
In the realm of Business Process Management (BPM), clarity is king. Before diving into complex algorithms or granular task details, organizations must first establish a shared understanding of their business activities. This tutorial explores the foundational layer of BPMN (Business Process Model and Notation): Level 1: Process Maps. We will analyze the architecture of a Customer Service Request Flow, breaking down the visual elements that make these diagrams powerful communication tools.
1. The Philosophy of Level 1 Modeling
Process Maps, often referred to as Simple Flow Charts, serve as the “Executive Summary” of business operations. Unlike detailed technical diagrams that explain how a task is performed, Level 1 maps focus exclusively on what happens in sequence. Their primary purpose is to provide a high-level overview that is accessible to stakeholders at all levels of the organization, from the C-Suite to new hires.
When constructing a Level 1 model, the guiding principle is minimalism. You strip away the noise to reveal the skeleton of the process. This ensures that the diagram remains easy to understand and quick to modify as business requirements evolve.
2. Analyzing the Architecture: The Customer Service Flow
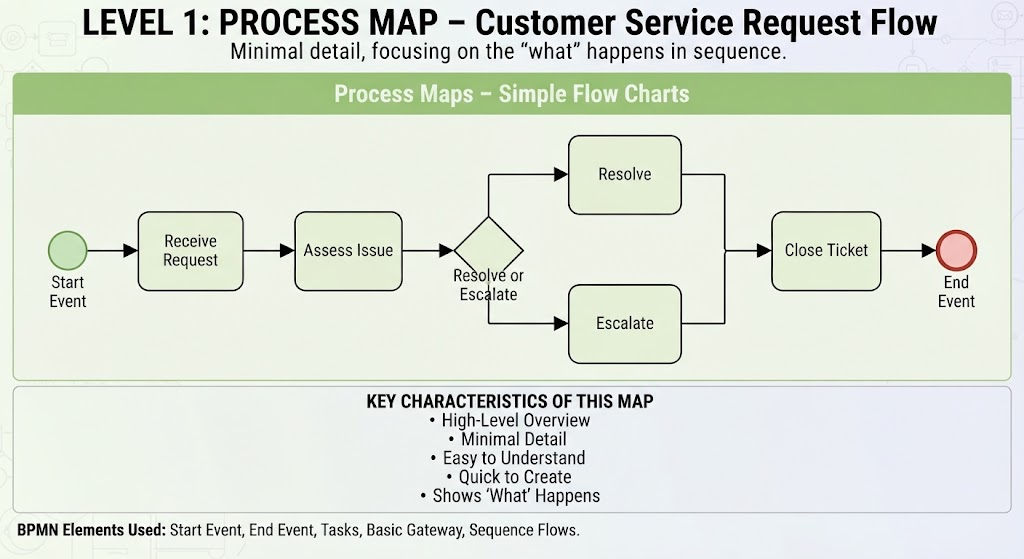
Let us walk through the specific example provided: a Customer Service Request Flow. This diagram illustrates the lifecycle of a support ticket from creation to resolution. We will examine the BPMN elements used to construct this narrative.
A. The Lifecycle Events
Every process needs a clear beginning and end. In BPMN, these are denoted by Events.
- Start Event (Green Circle): Located on the far left, this signifies the trigger. In this scenario, the process begins when a request is received.
- End Event (Red Circle): Located on the far right, this marks the successful termination of the process, indicating that the ticket has been closed.
B. The Core Activities (Tasks)
Between the start and end, the process is driven by Tasks—the actual work being performed. Notice that in Level 1 modeling, these are represented as simple rounded rectangles without sub-process details.
- Receive Request: The initial intake of customer data.
- Assess Issue: The critical analysis phase where the nature of the problem is determined.
- Close Ticket: The administrative step to finalize the record.
C. The Logic of Decisions (Gateways)
Real-world processes are rarely linear; they involve choices. The diagram utilizes a Gateway (the diamond shape labeled “Resolve or Escalate”) to represent this branching logic.
After the “Assess Issue” task, the process hits a decision point. The model splits into two parallel paths:
- Path A (Resolve): If the issue can be handled immediately.
- Path B (Escalate): If the issue requires specialized attention.
Crucially, both paths converge back into a single flow before reaching the Close Ticket task. This demonstrates how different outcomes can lead to the same final state.
3. Key Characteristics of Effective Process Maps
To ensure your Level 1 models are effective, they must adhere to the following characteristics:
- High-Level Overview: Do not get bogged down in micro-details. Focus on the major milestones.
- Minimal Detail: Avoid complex data objects or swimlanes unless absolutely necessary for the specific audience.
- Quick to Create: These diagrams should be agile tools for discovery, not rigid blueprints.
- Universal Understanding: The visual language must be intuitive enough for non-technical stakeholders to grasp immediately.
4. Implementation Strategy
When should you deploy these maps? They are best utilized during:
- Initial Process Discovery: To map out the “As-Is” state in workshops.
- Executive Presentations: To communicate process scope and boundaries to leadership.
- Onboarding: To give new team members a quick snapshot of their role within the larger business context.
By mastering the architecture of Level 1 Process Maps, you lay the groundwork for deeper process analysis and optimization in later levels.